Bitcoin’s price is falling sharply. It lost 5 pct today, and retraced almost 8 pct against its July 24th intermediate top. Bitcoin’s chart (first chart below) looks scary. We start getting messages from readers with a request to write about Bitcoin’s crash. As we see a crash on Bitcoin’s chart we try to understand whether there is (sufficient) reason to be concerned at this point in time.
We would definitely agree with readers if they start getting concerned, at least if it would be based on the form and structure of the first chart embedded below.
Note, before proceeding, that this 5 pct crash is nothing compared to the one week 40 pct price drop in December last year. We wrote, back then, that Bitcoin Typically Crashes Mid-January, and there was indeed another crash in January.
Also, we do not recommend to read the news as that is confusing at best. Take for instance this article on a large Bitcoin site which is just aimed to scare people off. Even on large mainstream media sites like Fortune.com there are rather useless Bitcoin crash articles which are not adding sufficient value to be worth spending an investor’s time.
Bitcoin’s chart shows a crash this week?
Back to this week’s price drop in Bitcoin, there are 2 important things to point out.
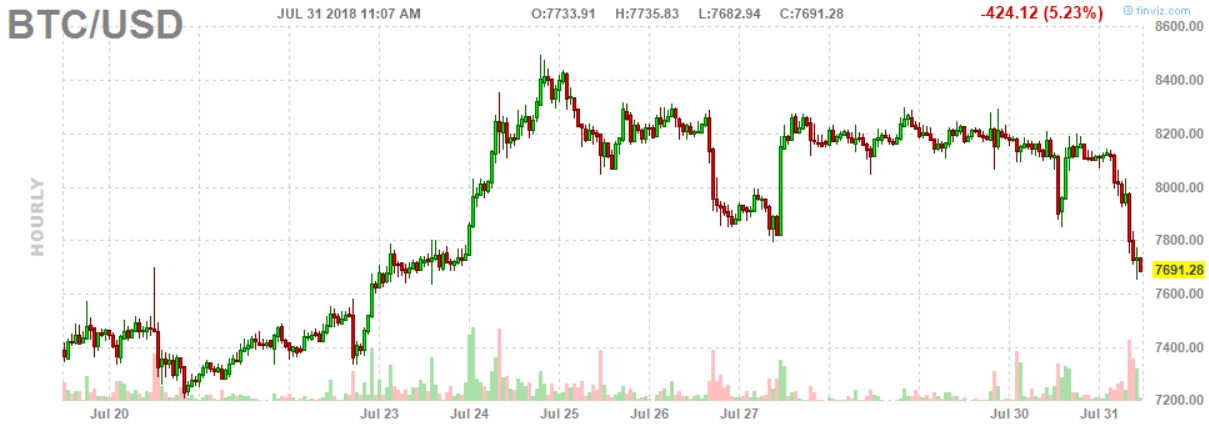
First, on the first chart outlined below, there is no breakdown visible. A breakdown is a chart technical term which indicates that a rising pattern is invalidated in which case a bearish trend starts. The first chart would really be scary if Bitcoin’s price was falling below $7400 as that would have been a breakdown. It is not happening, at least not yet.
Second, and way more important, the timeframe of the chart. The first chart below is Bitcoin’s hourly chart. Readers are so focused on the very short term that they forget the big picture which is way more important than the short term.
Crypto is, by far, the most volatile asset out there. It is way too risky to focus on the short term charts. The big picture trend(s) must be respected. That’s why the daily chart, in log scale, is the one of primary focus, combined with the weekly chart.
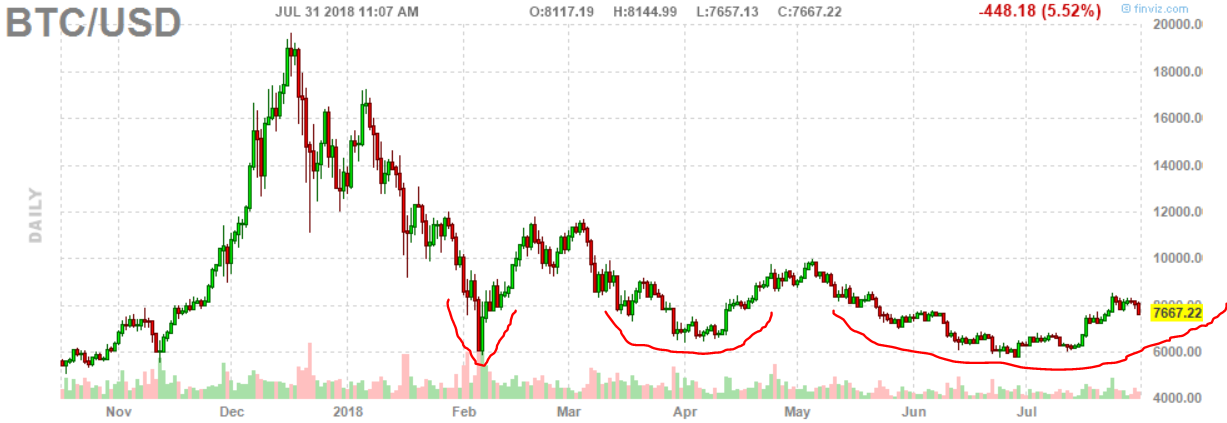
Bitcoin’s daily chart is outlined below, see the second chart.
This daily chart looks much more constructive than the hourly, and that is the whole point we are trying to make.
The point is this: there is no crash whatsoever if you zoom out, on the contrary, there is a constructive pattern.
Look how the $6k level in Bitcoin has been holding up very well, with a V-shaped recovery first, followed by longer rounding bottoms, a very constructive pattern.
So to answer the question: are we concerned? No, we are not, until Bitcoin dips below $6k there is no reason whatsoever to be concerned. This is a normal recovery process.
This analysis, about much more cryptocurrencies and blockchain stocks, in great detail, very actionable, is what premium subscribers of InvestingHaven’s blockchain & crypto investing service receive. Become a member now >>