Broadridge Financial Solutions (BR) is a stock with a beautiful long term momentum pattern in the last 7 years. It now crashed from $140 to $90 in 3 months time, a decline of 36 pct. Is it time to buy or time to sell Broadridge Financial Solutions?
We do a top down analysis of the chart, not fundamentals, in order to answer the question ‘time to buy or time to sell Broadridge Financial Solutions‘?
Remember, as per our 100 investing tips we always ‘start with the chart’. A strict and disciplined way to identifying trends on charts is required. The most fundamental way to apply the ‘start with the chart’ principle is the top down approach: first study the monthly chart as it shows the ongoing dominant trends, then the weekly chart, only after this the daily chart. This is the right approach to understand trends. Only if and once patterns or opportunities on all 3 timeframes are in synch is it justified to do an investment. In other words the 3 timeframes have to confirm each other, not divergence.
Let’s review the 3 timeframes of Broadridge Financial Solutions, and see whether we can have a confirmation of the different timeframes (reliable) or whether we see a divergence (unreliable).
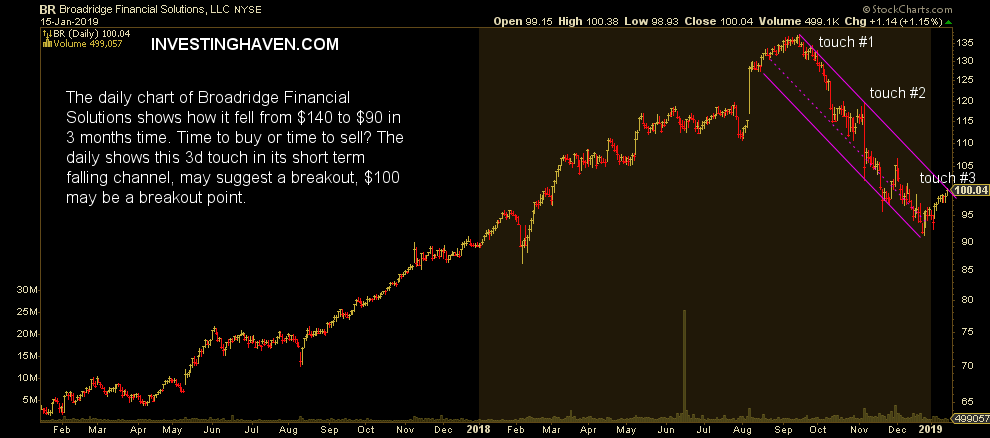
Daily chart of Broadridge Financial
The daily shows this 3d touch in its short term falling channel, may suggest a breakout, $100 may be a breakout point. Ideally, 3 daily closes above $100 would confirm this breakout.
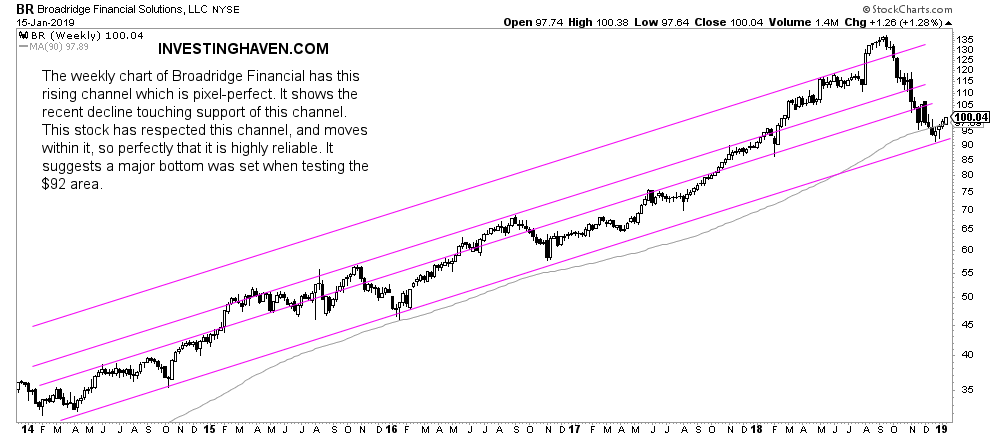
Weekly chart of Broadridge Financial
The weekly chart of Broadridge Financial has this rising channel which is pixel-perfect. It shows the recent decline touching support of this channel. This stock has respected this channel, and moves within it, so perfectly that it is highly reliable. It suggests a major bottom was set when testing the $92 area.
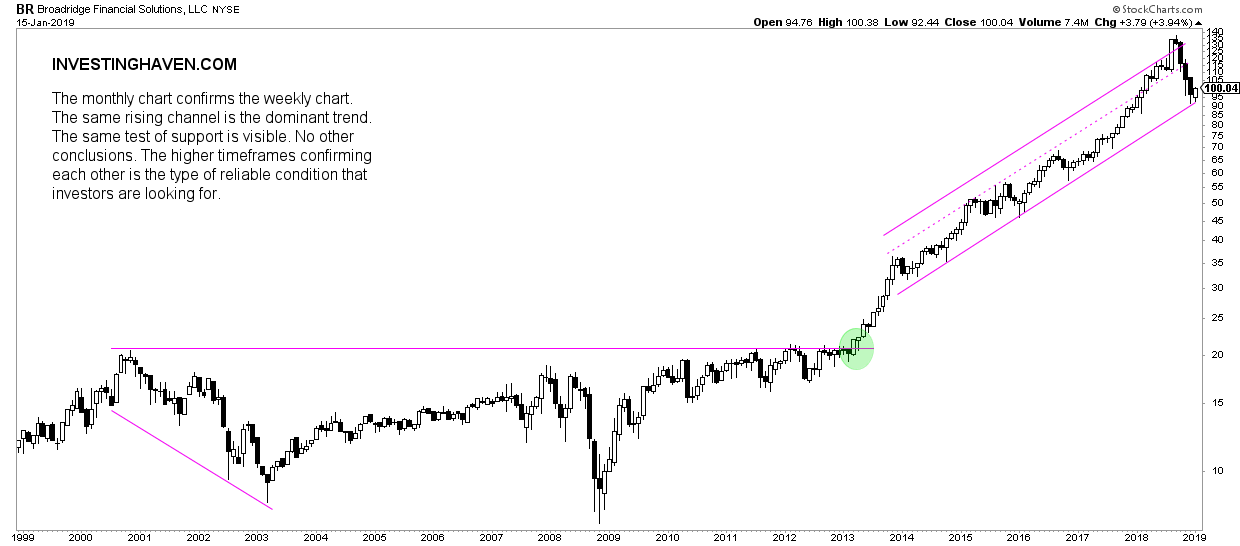
Monthly chart of Broadridge Financial
The monthly chart confirms the weekly chart. The same rising channel is the dominant trend. The same test of support is visible. No other conclusions. The higher timeframes confirming each other is the type of reliable condition that investors are looking for.
Conclusion
If and once Broadridge Financial moves higher from here, i.e. $100, and closes 3 consecutive days above it, this stock will trigger a giant buy alert.


