
We have major signals of a major turning point in markets. We’ll pick two of them, and while it sounds like “just two” is not enough to back up an important forecast we are saying “these two are really important.” You don’t need many indicators, you need a few that you can interpret correctly. In the end, as said in 100 investing tips, every market cycle has a dominant force. It is crucial to understand what drives markets, and find the few charts that move the market in each cycle.
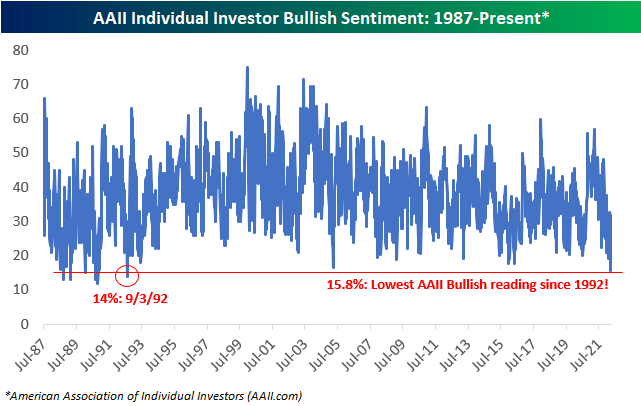
First, a chart which makes you go hhhmmm: Investors are more bearish today than they were during the Dot Com Crash, the Financial Crisis, or the Corona crash.
Individual investor sentiment from the American Association of Individual Investors (AAII) came in at just 15.8% this week. That’s the lowest reading since September 1992!
Commentary from Bespoke Investment:
Investor sentiment is typically viewed as a contrarian indicator. The AAII question specifically asks individual investors for their view on the stock market over the next six months. We sent subscribers this chart recently showing the percentage of time that the S&P 500 Total Return index has been positive over various time frames. Over all six-month periods in the index’s history, it has been positive 71.1% of the time. Most investors probably find themselves in the bearish camp right now either because their accounts are down or they keep reading the same headlines concerning inflation, interest rates, and geo-political uncertainty, and not because they have some magical insights about where the world will be six months to a year from now.
If anything, these extreme bearish readings tend to coincide with turning points in markets.
No surprise, we explained our view on turning points in Value vs. Growth: What Do The Charts Suggest For 2022?
Moreover, in our Trade Alerts weekend analysis we featured a few must-see charts related to the Nasdaq and the highly predictive Nasdaq volatility index. They will help us tremendously understand market direction for the medium term.
Here is another chart that clearly has arrived at a critical juncture: 10 year bond yields.
Any time bond yields are rising or falling fast, they tend to create turmoil in some or all markets. With a very fast rise from 1.57 to 2.82 it was to be expected that it would leave growth stocks beaten down. But this could start changing now, and we emphasize the words ‘could’ and ‘start’. Bond yields should stabilize here, and not continue to move higher.
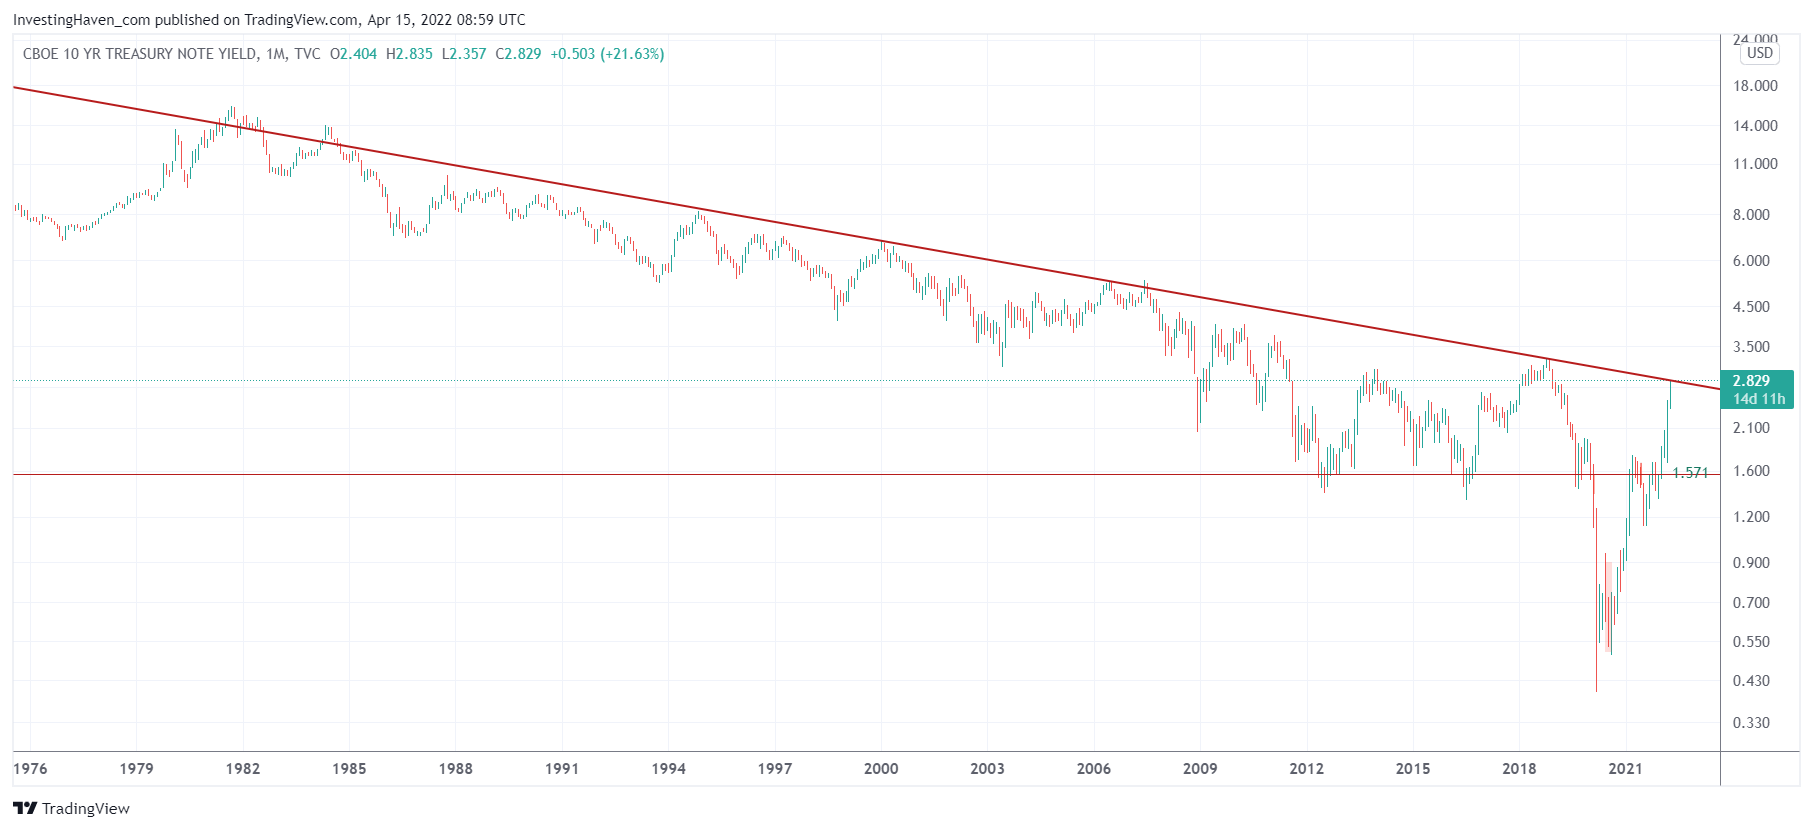 Clearly, bond yields have printed a huge inverted head & shoulders pattern in the last 2.5 years. This pattern is complete now, time for a new era? Is this another confirmation of a turning point?
The million dollar question is which segments will do well, which not. That’s the question we continue to answer, each and every week, in our detailed Momentum Investing weekend alerts. Moreover, with our S&P 500 auto-trading service, we offer the convenience of our premium members not to be worried about turning points. Our short term trades simply follow our algorithm’s buy and sell signals, there is no headache about turning points, crashes, bullish vs. bearish momentum. More info about our auto-trading service? Please get in touch, simply show your interest in our contact form.


