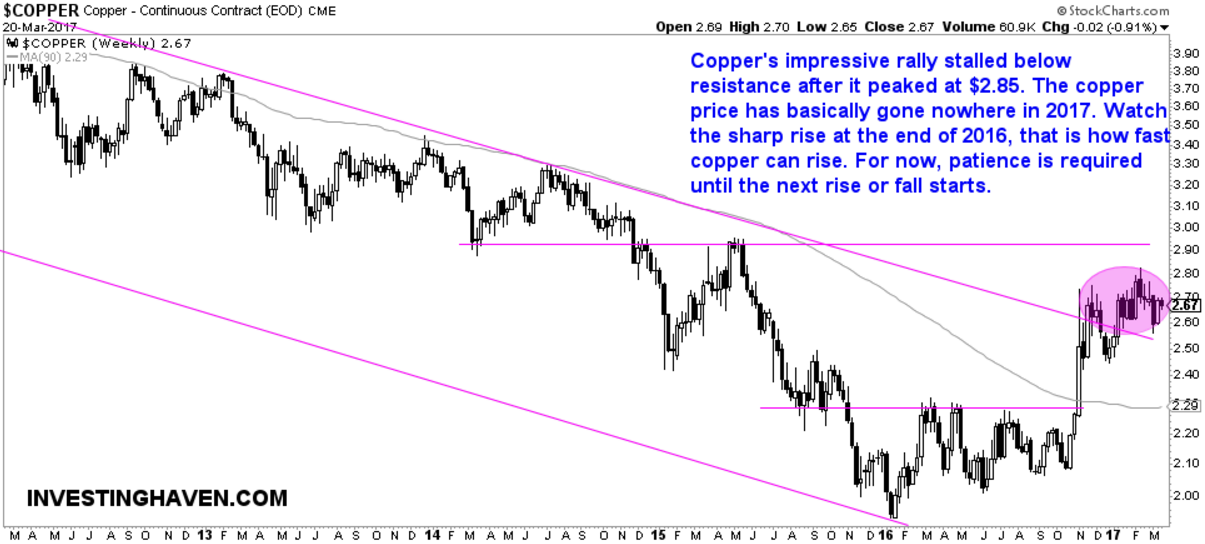
Copper was a very hot market at the end of last year. The price of copper shot 40 percent higher, and so did copper miners like Freeport McMoRan. In 2017, copper has basically gone nowhere. It is trading sideways in a narrow range.In February, copper’s price chart looked spectacular with 6 breakout attempts. However, momentum faded and copper did not manage to break out.
Note how chart analysis helps identify trends. The peak of February at $2.85, currently resistance, was former support represented by the purple horizontal line. The line comes in at $2.9 but could have been drawn at $2.85. This is the basis of chart reading, and it helps answer the question whether it is time to buy or sell.
Last year, we clearly identified that it was the ideal moment for investors to buy the copper market. Prices were breaking out, and basis chart analysis flashed a buy signal. Also, when the copper price was at a secular breakout point, we flashed an alert basic on the pattern(s) on the chart.
Copper investors should be in waiting mode right now. Momentum has faded, and that is the ultimate test for both bulls and bears. This not a time to enter a position. Copper will be very bullish once above $2.85, and bearish once below $2.50. In-between those prices, copper is neutral.
Meantime, Base Metals Investors are collectively looking suffering as zinc and aluminium are also consolidating.