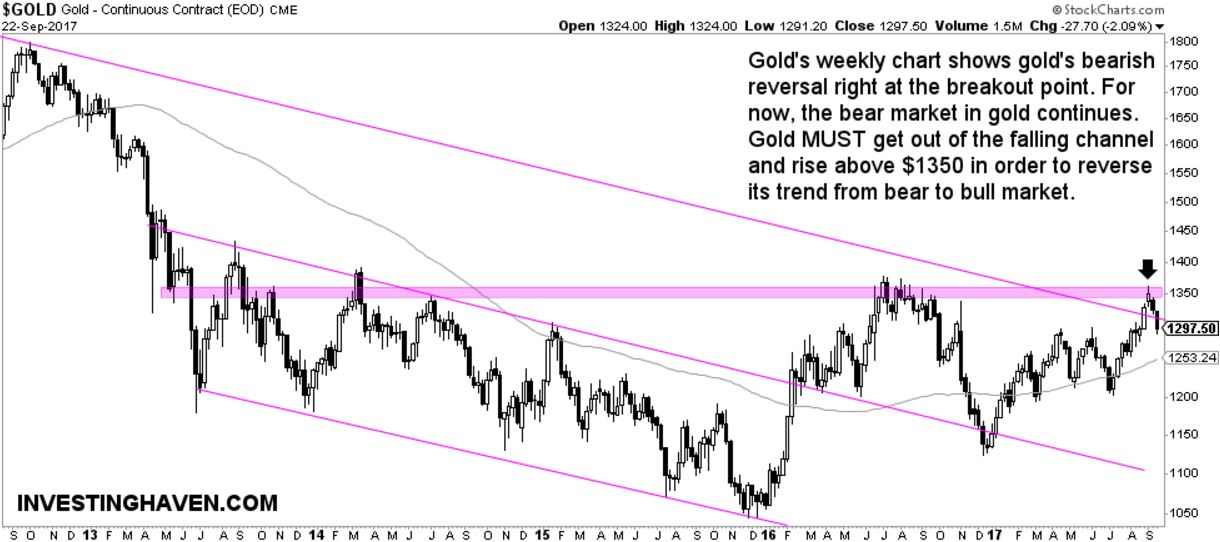
Gold peaked at $1350 two weeks ago. Gold’s weekly chart shows a bearish reversal. That is not good news for gold bulls. For now, the bear market in gold continues … until proven otherwise.
Gold’s bearish reversal is shown on the chart with the black arrow. The $1350 level marks a triple top, heavy resistance which goes back to 2014. Not any market can easily break out of that type of resistance, that is a natural law.
We identified a safe haven play early September, as explained in Safe Havens On The Rise, but that trend seems to be weakening now. We wrote in our article that a breakout in the gold market would validate that trend. However, a failure would mean the safe haven trend would not be that strong. With gold’s bearish reversal the odds favor a risk asset play rather than a safe haven play. The Yen and U.S. Treasuries are also weakening. For now, the Mega Breakout in Gold is invalid.
What’s next for gold ?
Gold can now do a couple of things, and it bears watching which direction it is going:
- One possibility is that gold falls just a little bit lower, and sets a higher low, at $1225. That would suggest the safe haven play would be intact. We will found out about that scenario in just 2 to 3 weeks.
- Another possibility is that gold continues lower, and falls towards the lower area of the fallling channel at $1100.
- A third option is that gold starts a longer term consolidation pattern. That would be a transition phase from bear market to flat market. It would build a base for a new bull market later in the future.
At this point in time we have a hard time reading where gold exactly is going. From an intermarket perspective the safe haven play was a clear one, but it could well be that the risk asset play remains dominant. There are simply not enough signs of a clear trend currently. In such a scenario smart investors give the market the time it needs to “sort things out”.