This article features 5 commodities charts which reveal our commodities outlook for 2019. We are not trying to make a forecast here, but indicate the critical commodities charts that must be monitored closely as they are the key driver for our commodities outlook for 2019. Note though that these commodities chart, and how they resolve in 2019, may have a significant impact on our commodities forecasts, first and foremost our gold forecast 2019 (GOLD) and silver forecast 2019 (SILVER).
It goes without saying that the commodities market is crucial. Not only because it has strong potential gains (the downside of it is that there is lots of downside because of the high level of volatility) but also because it has an important meaning in global markets. If commodities do well it implies that there is ‘risk on’ as well as a decent level of inflation. This elevates the value of our commodities outlook for 2019 which is the result of analyzing these 5 leading commodity charts.
As per Wikipedia the number of traded commodities is significant, likely larger than you may think. Still, it is a handful of commodities that are really leading indicators, and worth following closely. Those leading commodities are able to move markets.
Commodities Outlook for 2019: Inflation chart
First and foremost, as per our inflation forecast for 2019 there is a possibility that inflation has started a new cycle. If that is the case we will see a rising level of inflation, mildly or wildly, in the next few years. Inflation, of course, is one of the key drivers for our commodities outlook for 2019.
How do we derive this conclusion? The leading inflation indicator from Martin Pring over at StockCharts.com.
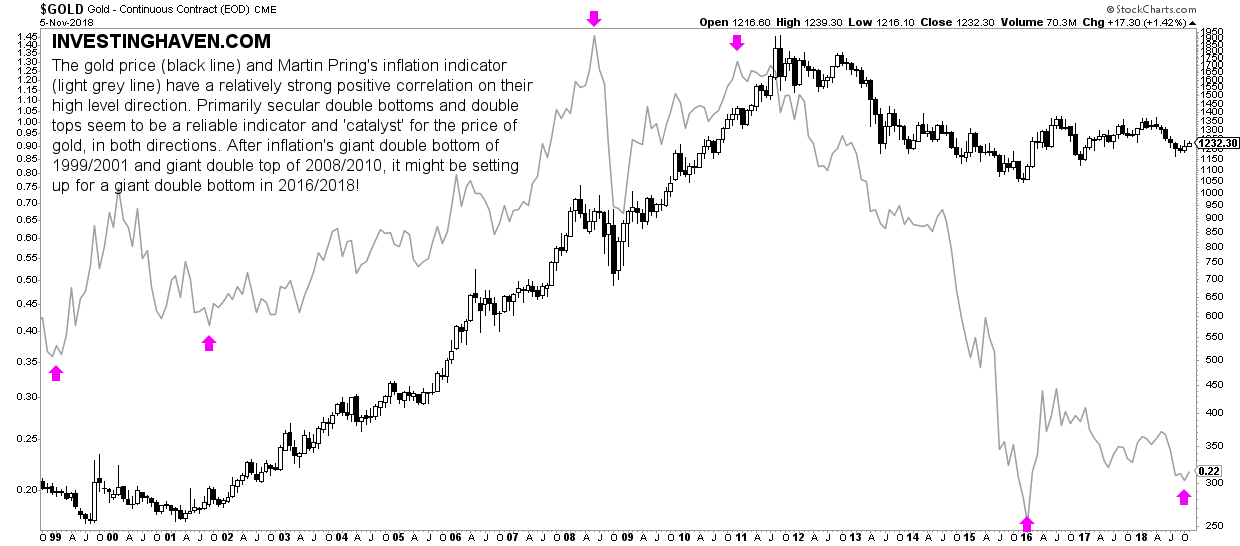
Below we look at the gold price overlaid by Martin Pring’s inflation indicator. This is the key finding from this chart:
The gold price (black line) and the inflation indicator (light grey line) have a relatively strong positive correlation on their high level direction. Primarily secular double bottoms and double tops seem to be a reliable indicator and ‘catalyst’ for precious metals prices, in both directions. After inflation’s giant double bottom of 1999/2001 and giant double top of 2008/2010, it might be setting up for a giant double bottom in 2016/2018!
It is this last sentence that is key: “After inflation’s giant double bottom of 1999/2001 and giant double top of 2008/2010, it might be setting up for a giant double bottom in 2016/2018.”
The chart indicates the major double bottom in 1999/2001 (with a higher low) and the major double top in 2008/2010 (with a major lower high). In a somehow similar fashion the 2016 major bottom may be a higher low against the 2018 bottom.
In other words, this chart suggests that (1) the high level direction of inflation and gold are correlated (2) inflation and the price of gold both suggest they will trend higher in 2019.
** Update on January 13th, 2019 **
[Ed. note: this paragraph was added in the 2nd week of 2019 just to followup on how our charts published 3 months ago are performing.]
Our conclusion from the most up-to-date inflation chart: no change in the potential for a major double bottom. This underpins a bullish outcome in the context of our commodities outlook 2019.
Commodities Outlook for 2019: Crude Oil chart (OIL)
However, at the same time as we might get inflationary signals from the above chart, we see a breakdown happening in crude oil. This of course might have major implications in 2019.
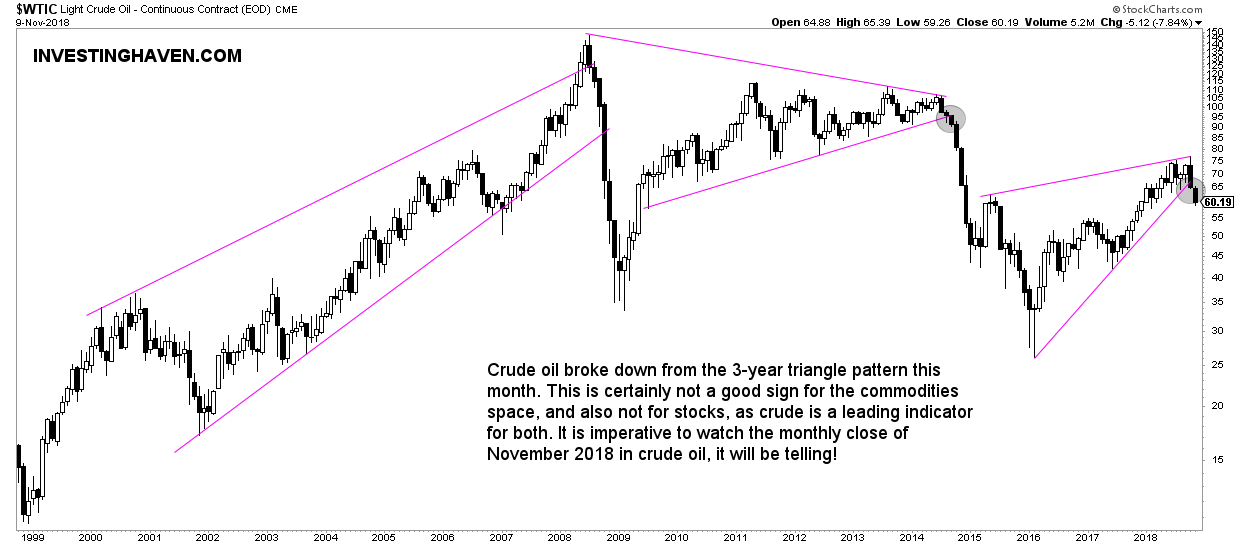
As seen on the second chart crude oil is breaking down from its 3-year triangle.
The longer a chart pattern builds up the higher the impact. In other words the breakdown from the triangle in 2014 had a catastrophic effect because it was a pattern that was in the making for 6 years.
The current 3-year pattern is important but the effect likely not as devastating as the one in 2014. Again, the word ‘likely’ is important in the previous sentence.
This chart bears watching, and the monthly close in November and December will be telling, also about inflation.
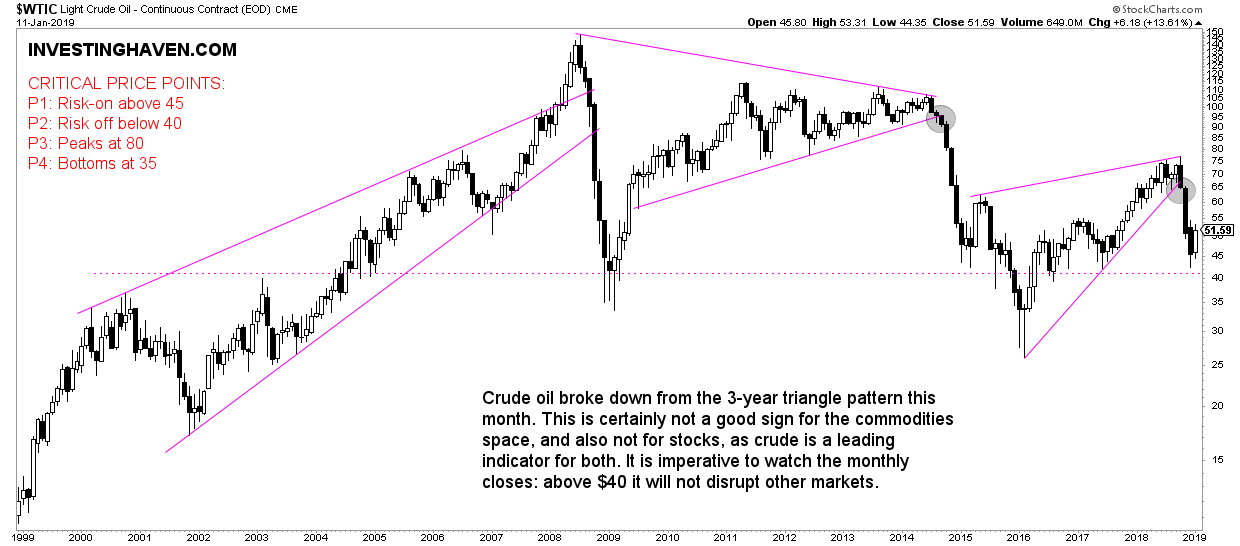
** Update on January 13th, 2019 **
[Ed. note: this paragraph was added in the 2nd week of 2019 just to followup on how our charts published 3 months ago are performing.]
This is not only an updated chart of crude oil, but also it shows the critical price points as per our new chart format. Note how crude oil fell to a secular support level right above $40. Crude oil is in ‘good’ territory as long as it trades above $45. Below $40 it will be very bearish, also for commodities in general and broad stock markets, because of intermarket effects!
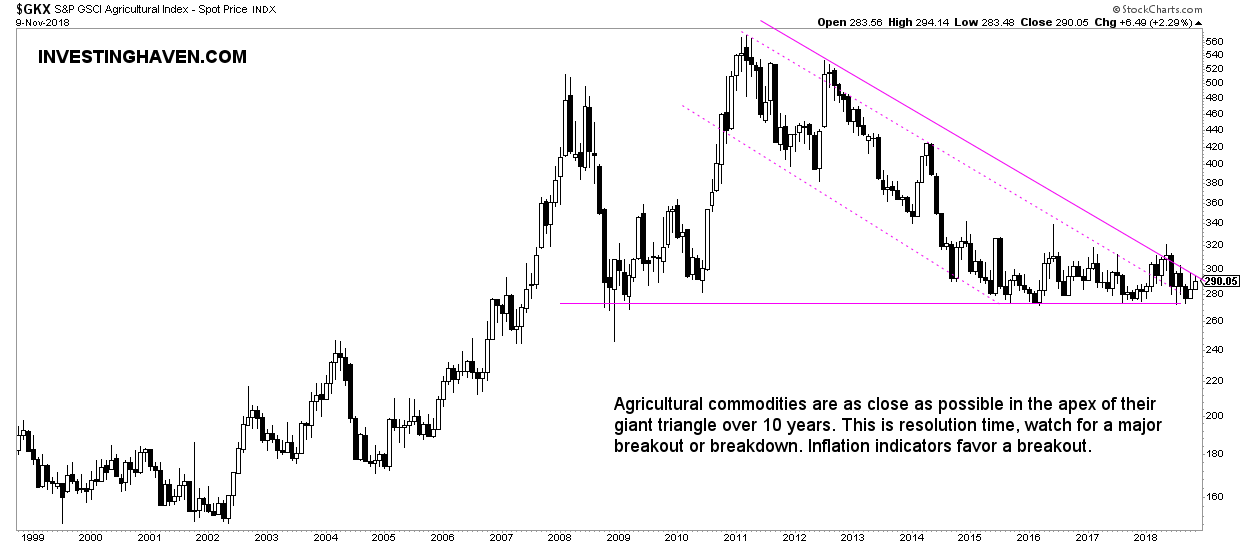
Commodities Outlook for 2019: Agriculture chart
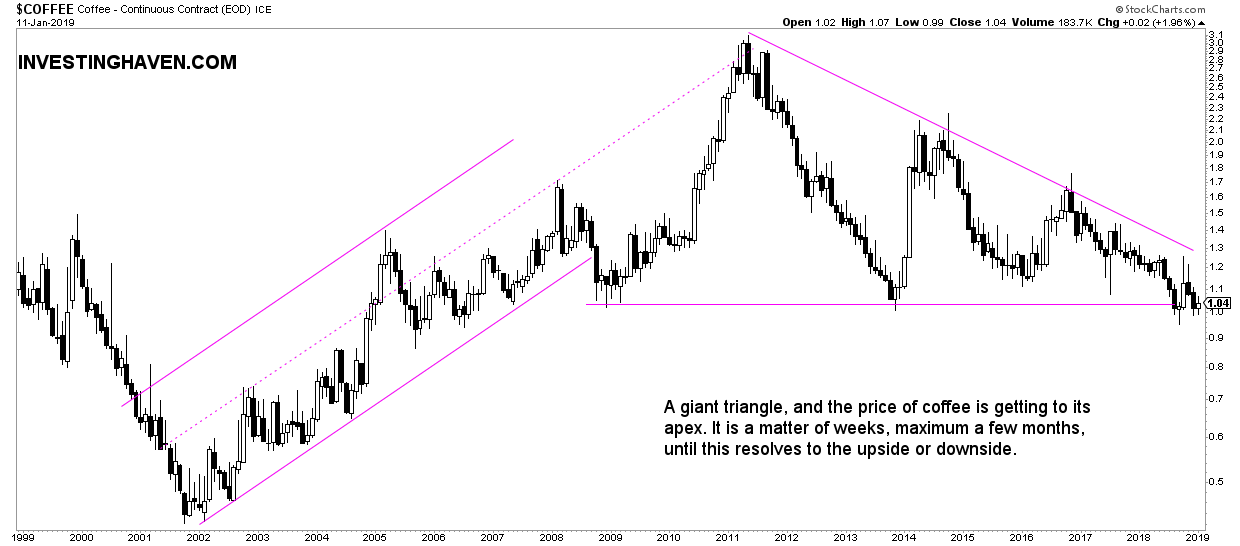
Agriculture has a chart setup that is closer to resolution. It is a matter of months, maybe even weeks, until this pattern resolves.
This giant triangle pattern in the making for 10 years now. In whatever direction this chart resolves it will be huge.
Based on the inflation chart above we would think an upside breakout is in the making.
However, the crude oil chart may bring the inflation indicator back down, resulting in either a continuation of the consolidation of coffee or, worst case, a break below this triangle pattern.
Anyways, in 2019 will see, for sure, a resolution in agriculture.
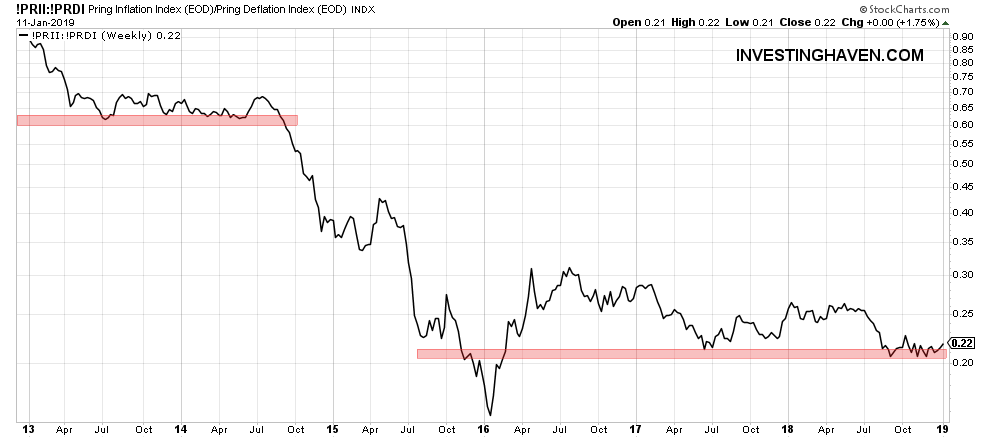
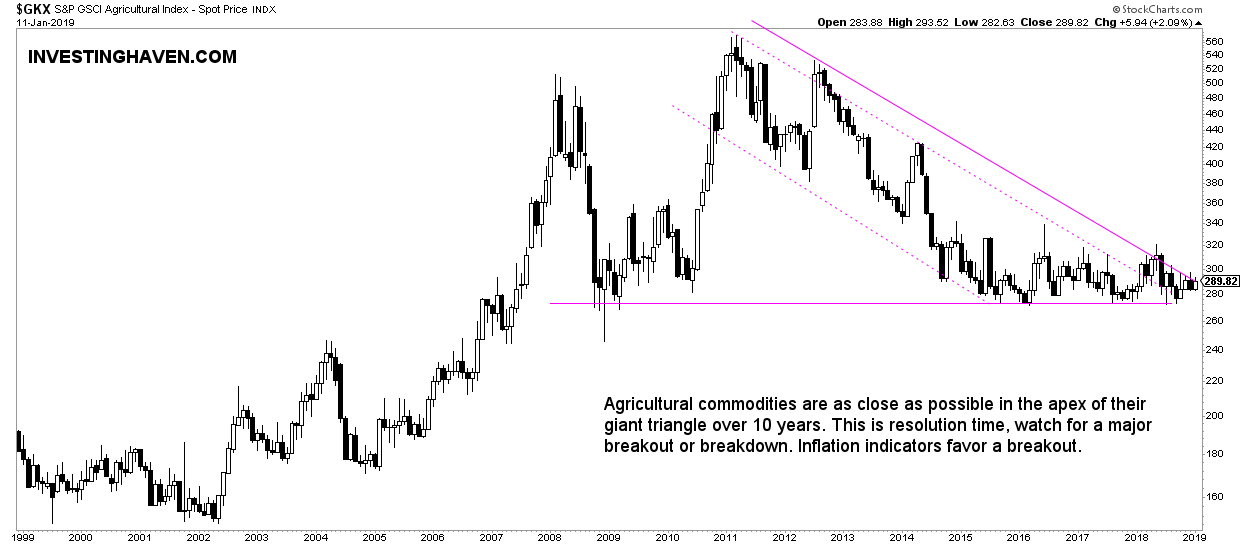
** Update on January 13th, 2019 **
[Ed. note: this paragraph was added in the 2nd week of 2019 just to followup on how our charts published 3 months ago are performing.]
This up-to-date chart of agriculture shows an improvement, and an attempt to break out. The apex of this triangle is even more narrow now. Two things may happen in 2019: Either agriculture breaks out and starts a new bull market, or it trades flat for a long time. The price point to watch is the 320 to 340 area in this GKX index.
Commodities Outlook for 2019: Coffee chart (COFFEE)
Coffee is one of the agricultural indexes included in the components of the chart (index) above.
We selected the coffee chart because of its amazing pattern.
The same comments as in the agriculture section above apply.
We will see a resolution of coffee in 2019.
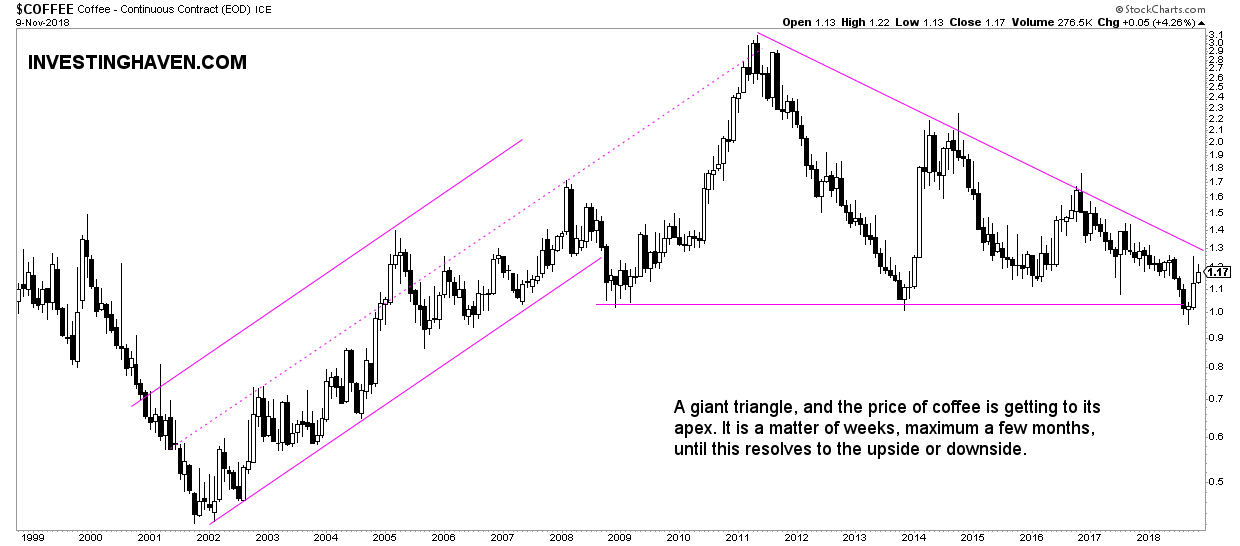
** Update on January 13th, 2019 **
[Ed. note: this paragraph was added in the 2nd week of 2019 just to followup on how our charts published 3 months ago are performing.]
This up-to-date coffee chart suggests that a major support area is being tested now. A break below this level, for sure monthly close, would be bearish. Note as well how the apex of this triangle is narrowing, so it will soon resolve to the upside or downside!
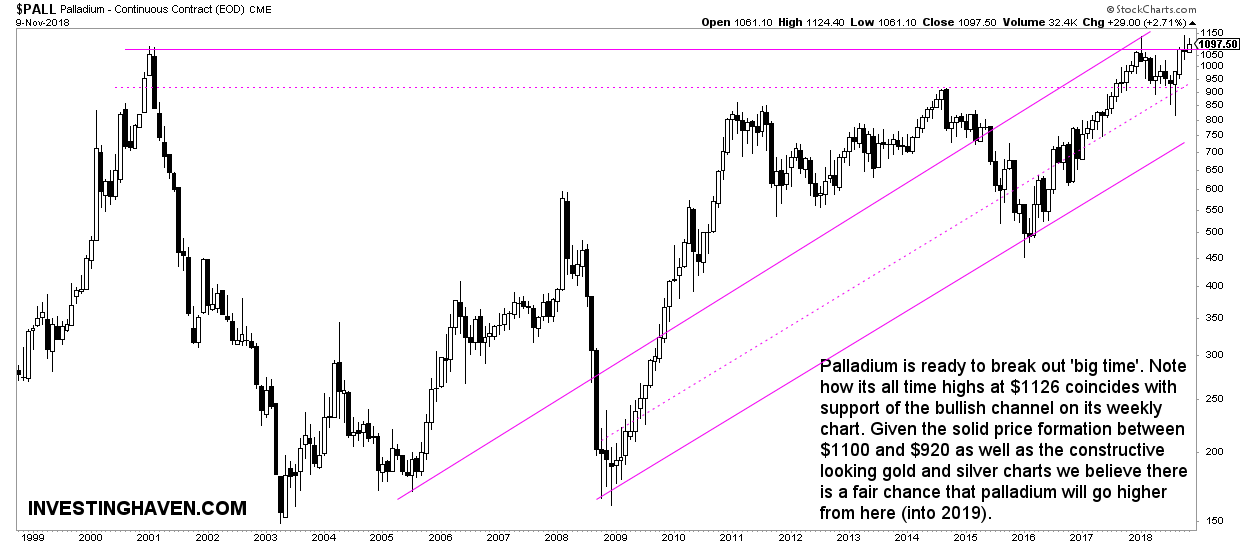
Commodities Outlook for 2019: Palladium chart (PALLADIUM)
Last but not least, the chart of palladium to close this article.
As per our palladium forecast for 2019 we see a couple of trends in the palladium market which may manifest in 2019.
First, there is a supply deficit which is building up for 5 years. We noticed a massive physical palladium exodus from ETFs which is reaching its limits. In a gold friendly environment, we see several primary and secondary indicators suggesting at much higher palladium prices to come in 2019. This of course gold to respect is recent lows, and trade higher in 2019.
InvestingHaven’s research team is on record with a palladium price forecast for 2019 of $1375 which likely will be a medium to long term top. It certainly is a profit taking price level if and once it gets there. Our thesis is invalidated if the $1125 does not get broken to the upside, or if a breakout appears to fail.
The monthly chart below shows a break-out is in the making. It is one of the must-see commodities charts for 2019.
How to play the palladium uptrend? Very simple, there are 2 options to get expsoure to palladium: one solution is to buy PALL ETF (easy but not always the liquidity you need so high risk), the other solution is to open an account with GoldMoney and buy/store physical palladium for you in a couple of simple steps. GoldMoney is one of the few online precious metals services that offers palladium.
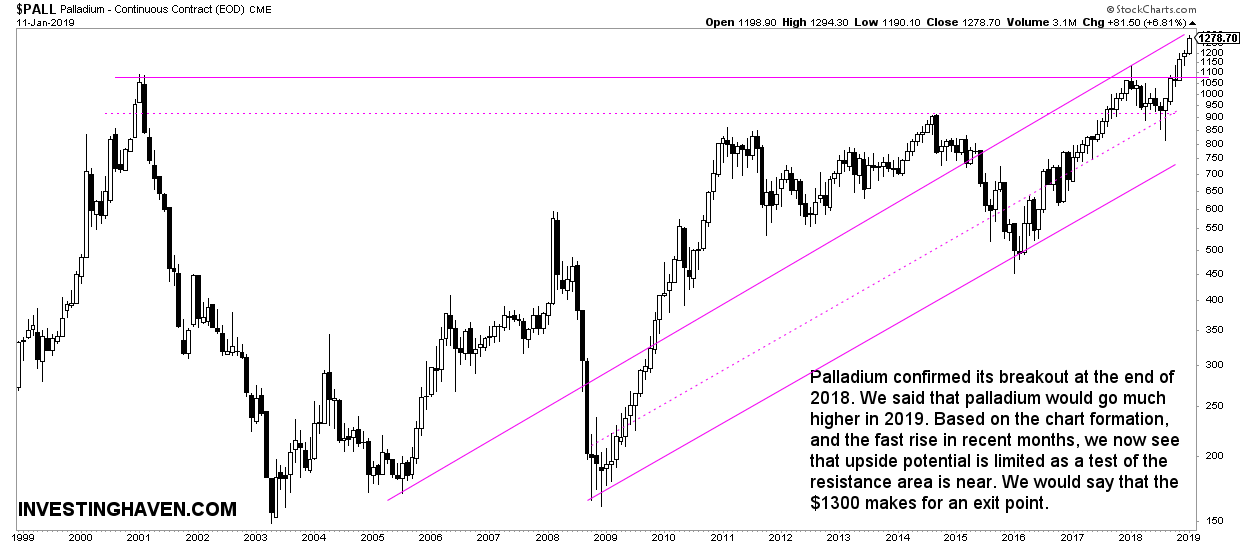
** Update on January 13th, 2019 **
[Ed. note: this paragraph was added in the 2nd week of 2019 just to followup on how our charts published 3 months ago are performing.]
Our palladium call was spot-on. As expected a breakout took place, and was confirmed successfully. We now see that an intermediate top is about to get reached, so we believe a defensive stance is required at current price levels!
Commodities Outlook for 2019
** Update on January 13th, 2019 **
[Ed. note: this paragraph was added in the 2nd week of 2019 just to followup on how our charts published 3 months ago are performing.]
Our conclusion after reviewing the 4 charts of leading commodities as well as the inflation chart? There is not one clear and concise picture across all commodities, it is a different story for each individual commodity. This makes things somehow more complicated for our outlook.
If anything it is clear that some commodities are ready for a major move, either higher or lower. As per the inflation chart we would expect a major bottom in inflation was set in 2016, and a giant double bottom was set recently. This would underpin a mildly bullish commodities outlook for 2019.


