Gold is improving. It’s not ready to start a ‘big move’. It’s presumably in the early stages of a new bull run. In this article we look at 2 fundamentals that tell us a clear message: gold will eventually catch up. When exactly isn’t clear, but the gold price chart helps us understand the timing of gold’s coming bull run. Amusingly, gold is following *exactly* the path that we laid out in our gold forecast 2021 which we wrote 6 months ago: we predict a strong second half of 2021 in precious metals.
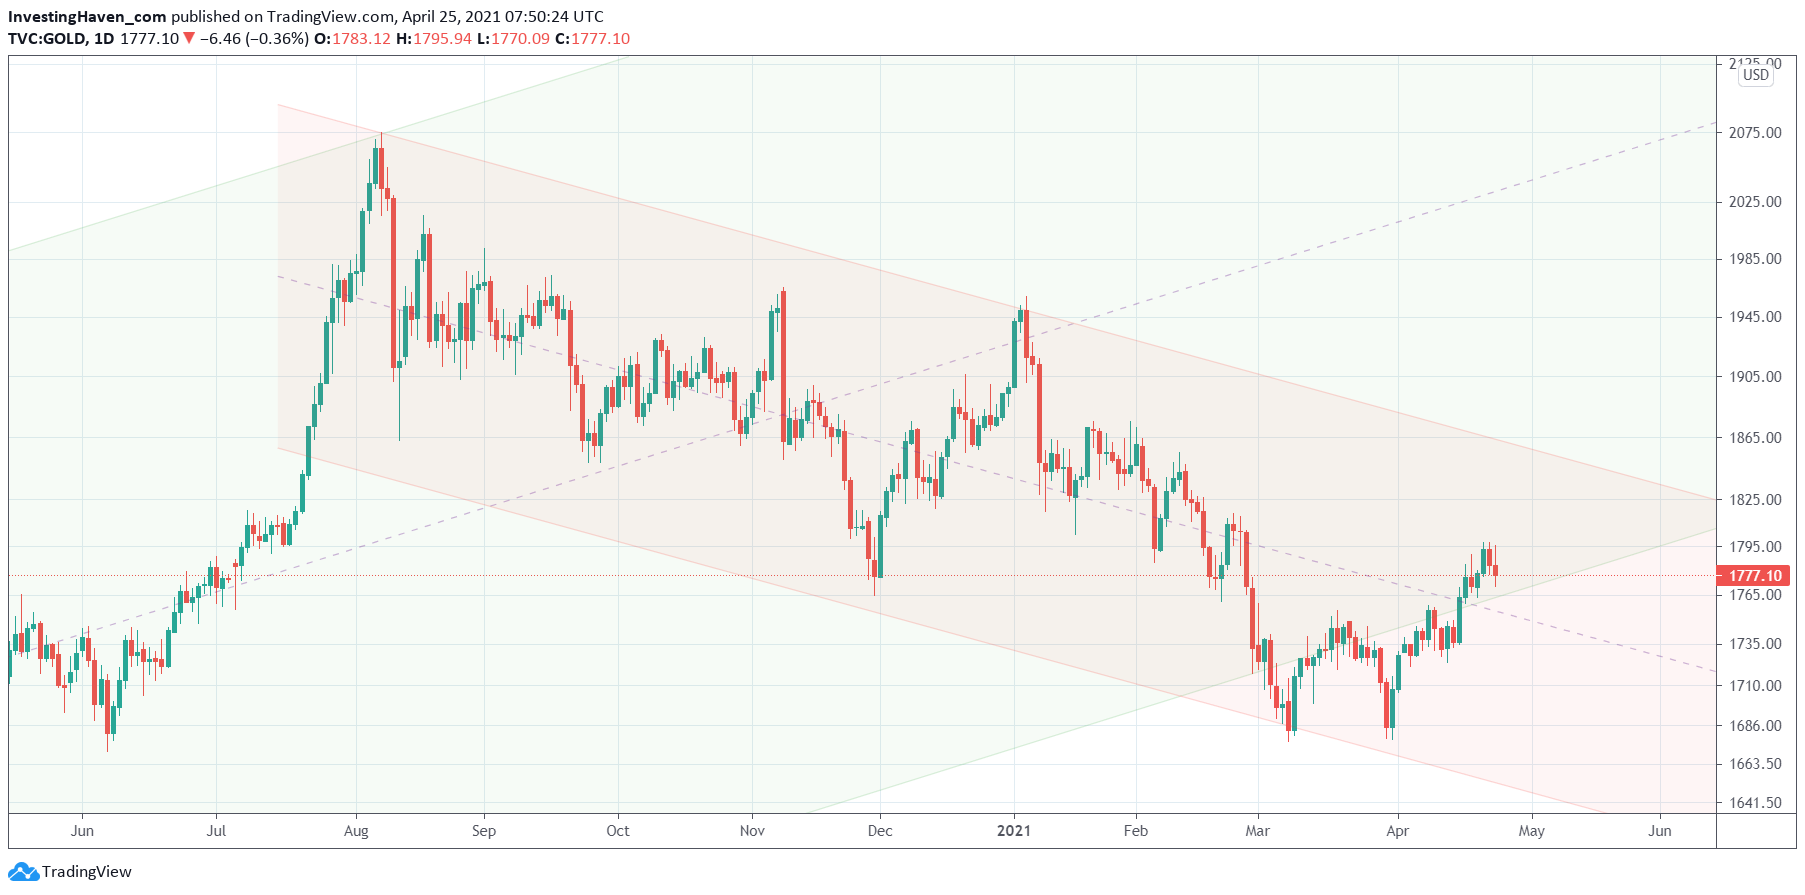
A few weeks ago we wrote this piece Gold: Will The Tactical Bear Win Or The Secular Bull Market. We identified 2 trends on the daily gold price chart, the one featured below.
First, the secular bull market that started in June of 2019. That’s the trend represented with the green rising channel. A powerful uptrend that started 2 years ago, saw a big drop during the epic Corona crash sell off, and continued its rise only to set a major top in the summer of 2020.
Second, the tactical bear market that started after gold set a major top in the summer of 2020. See the red falling channel on the chart.
Interestingly, gold recovered in recent weeks, and got back into its secular rising channel. Very solid, especially after it looked extremely shaky a month ago!
We want to solve 2 questions as it relates to gold:
- Will gold eventually continue its rise?
- When will gold accelerate its rise.
The answer to the first question, according to us, is YES. The reason? See the next 2 charts.
The answer to the second question: once it clears 1825-1850 USD/oz, presumably right before the summer starts.
Here are the 2 fundamental charts that make us believe gold will continue its bull run in 2021.
Yes our point is simple, avoid the news. Don’t get caught up in this type of news flow that is meaningless for investors Gold Erases Gains as U.S. Data Refuels Recovery Optimism (just an illustration of 99% of gold news that is going to confuse investors more than anything else).
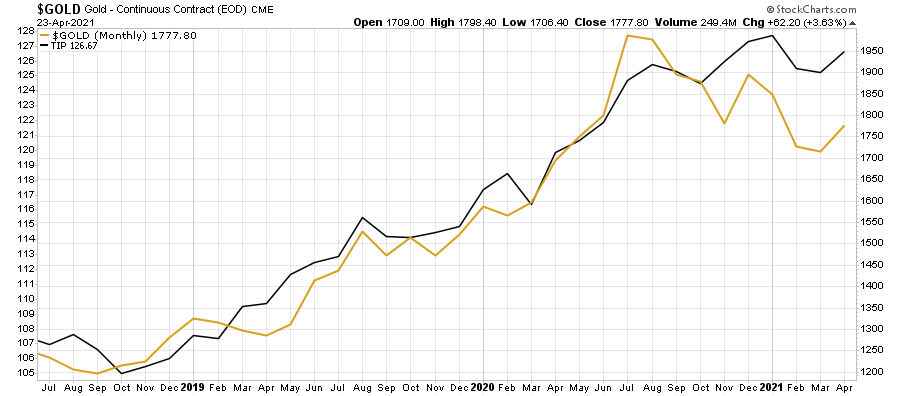
First, inflation expectations (TIP ETF). After a small dip in TIP ETF we see that is may be ready to continue its rise, and because of the very strong positive correlation between both assets we expect gold and TIP to both move higher.
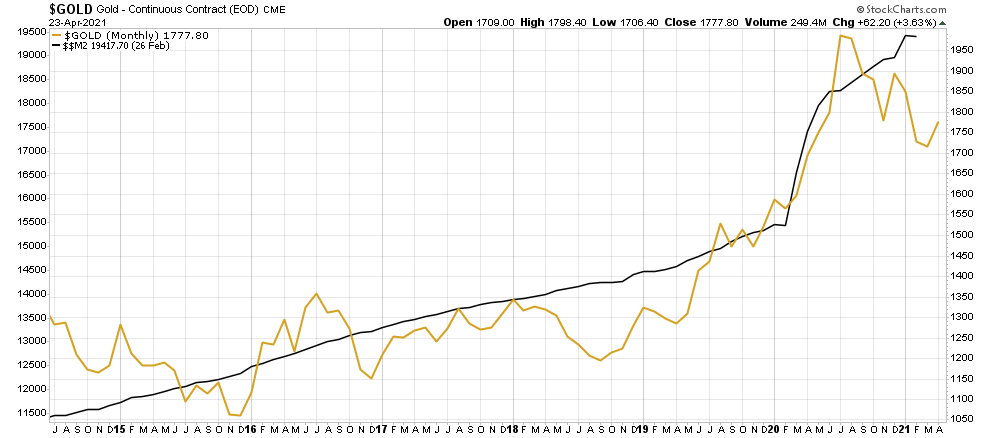
Moreover, and probably the most important fundamental indicator is reflected in the monetary growth. We use M2 on below chart (black line) and the price of gold (yellow line) to compare the trend of both.
Unsurprisingly, they move in the same direction. However, there are some divergences which mostly tend to last 3 to 12 months.
While M2 has continued to rise we see that gold struggled. We believe, directionally, that gold has to catch up with the monetary inflation trend. Not that this is not a timing indicator, but a trend indicator. For timing we have to check the daily gold price chart, particularly the break above the tactical downtrend (red falling channel).
In our Trade Alerts portfolio as well as our Momentum Investing portfolio we took a short term trade and longer term investment in the gold market.


