The Bitcoin (BTC) chart suggests 2 potential outcomes. Note that this is a recent evolution of the last week, and it makes another time the point to always stay open minded when analyzing markets (any market). So far we were thinking that Bitcoin’s 2019 setup was a huge symmetrical triangle, especially since its April 2nd breakout. Resolution date is immediate, any moment. However, what we may see happening now is a huge descending triangle in the context of the larger uptrend, with ultimate resolution date November 1st, 2019. Whatever happens we stick to our long term BTC forecast of $25k as a minimum target based on Bitcoin’s Strongly Bullish Long Term Chart.
Anyone recognizes this situation?
You are interested to know what specialists think of the current Bitcoin (BTC) price setup. Will it resolve to the upside or downside?
So you start looking for Bitcoin price related news. After clicking and clicking you end up without having any clue. Most articles have a bullish or bearish bias, but then add the opposite viewpoint without assessing the probability of the bullish vs bearish outcome.
The word that comes to mind is ‘worthless’ as well as ‘waste of time’.
What exactly is Bitcoin’s (BTC) price trying to do right now, let’s make it simple and straightforward for readers.
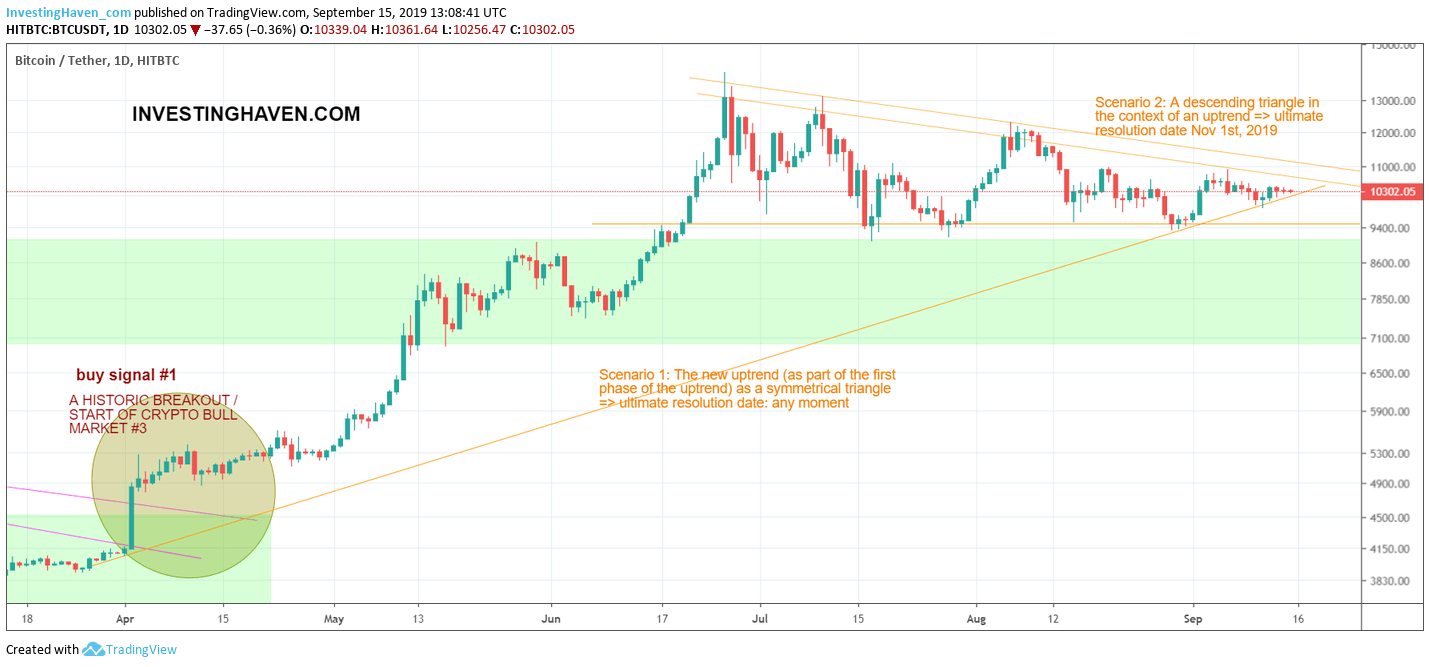
So far we always saw a symmetrical triangle which is indicated with ‘scenario 1’ on the BTC chart embedded below. We still feel strong that this is the dominant pattern.
If that’s true it can resolve any moment. There is large probability it will resolve to the upside.
However, since last week we also see a potential 2nd scenario playing out. It is indicated with ‘scenario 2’ below and it’s a descending triangle (in chart terms).
A descending triangle in a large uptrend should have a bullish outcome primarily because we have seen this in the past as well on BTC’s chart. The 2015/2016 uptrend had some similar setups, and they resolved to the upside. So one way or another it is part of the DNA of the BTC chart.
Still this 2nd scenario may see a breakdown, which according to us may be short lived (few months). We continue to believe in a strong secular bull market in crypto that is not over yet, on the contrary, as per our 5 Cryptocurrency Predictions.
Note that the ultimate resolution date for scenario 2 is Nov 1st, 2019.
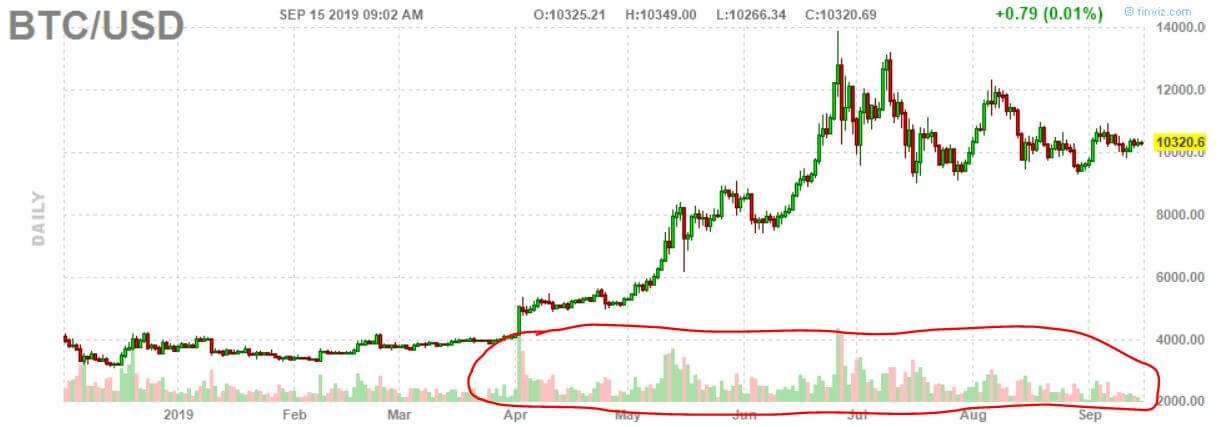
What requires special attention from investors is volume especially on the BTC chart.
Readers may ask themselves why only BTC and not the ETH or XRP chart?
The reason is very simple: BTC is the leading indicator for crypto, and it is the primary means of liquidity for all other coins.
When we look at the volume pattern (lack of volume) it reflects the lack of volatility especially in recent weeks. We have seen this before, look at what happened in March of this year. Suddenly though BTC’s price spiked, and so did trading volume.
We keep a very close eye on both chart setups outlined above combined with volume outlined below. The members of our premium crypto investing service will be the first ones to get lots of details on what’s going on, what we expect and which juicy trades we see (or which ones to avoid). Sign up here if you want to become a member >>