We did not cover cryptocurrencies in the last 2 weeks. Many are asking whether our Bitcoin forecast as well as XRP forecast are still valid. Hard to believe but the answer is ‘yes’ until proven otherwise. The recent crash was cataclysmic, but things may change fast in crypto land.
In order to assess the long term situation we first need to have a handle on the short term moves. In other words it is on the short term timeframes that we see the start of important long term moves.
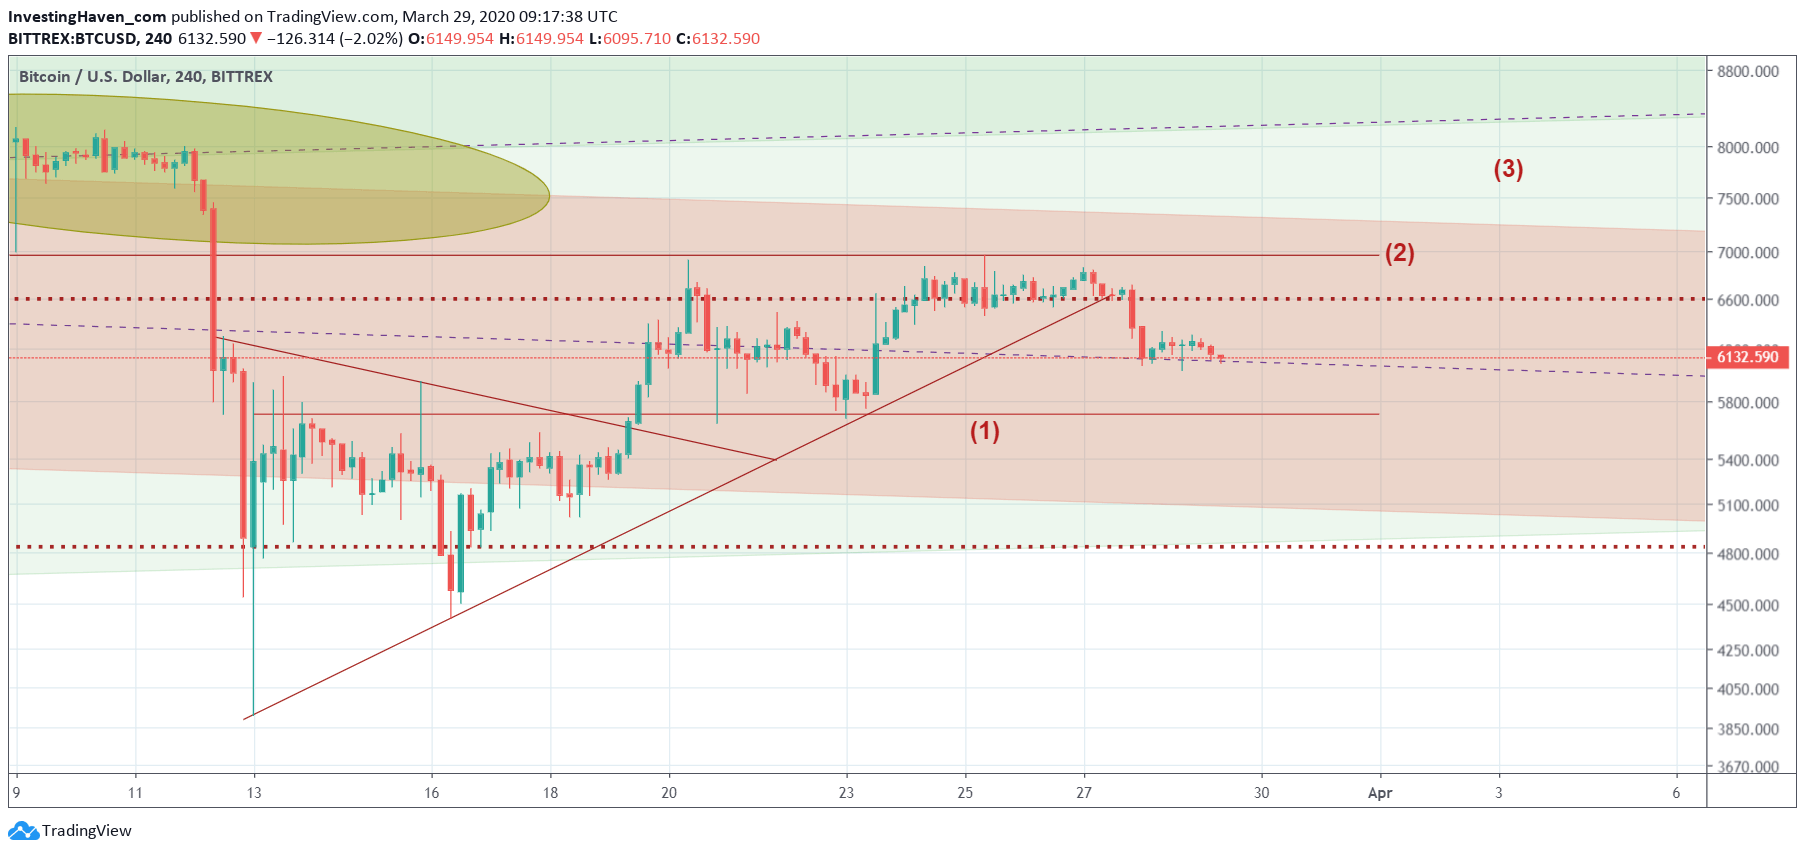
Our crypto premium members get guidance on medium and long term trends. The very important trend in play at this point in time is the consolidation on Bitcoin’s chart. The 4850 to 6950 USD level is a consolidation area.
As said it is important to understand what is happening in those long term trends particularly on the short term timeframes.
The consolidation area is visible on the chart with the red dotted lines, in the context of a falling channel in red. The short term timeframe suggests a bit more consolidation is required. Note how the recent decline in the last 48h brought BTC to the median line of this falling channel. It’s a good test, and those tests are good for crypto bulls.
Support comes in at 5750 USD.
We would not be surprised if the current level holds, but may also see a quick drop to the 5750 support level.
All this is good for the long term provided global selling ends here, as explained in Stocks Market: V Reversal, W Reversal Or Crash Continuation.
Our premium crypto members get guidance in these rough times. You too can receive our premium crypto work.