Global stock markets are about to turn bullish going into 2020. We see evidence of this on multiple charts and signaled by multiple leading indicators. First of all, the Euro is about to turn bullish. Second, chart-wise, the natural risk cycles on leading stock index Russell 2000 is about to end its risk-off cycle. Third, leading indicator for stock markets 20-year Treasuries look like they corrected sufficiently to start unleashing bullish energy to stock markets. As stock markets prepare to turn bullish again we forecast a tactical rally in precious metals stocks as per our gold forecast.
First, as said in our Euro article, the Euro is close to turning bullish. Its weekly chart suggests that any push higher from here will turn the weekly timeframe bullish. This will be the basis for a tactical bull market on the monthly timeframe.
This would be bullish for global stock markets as well as gold, silver and precious metals stocks.
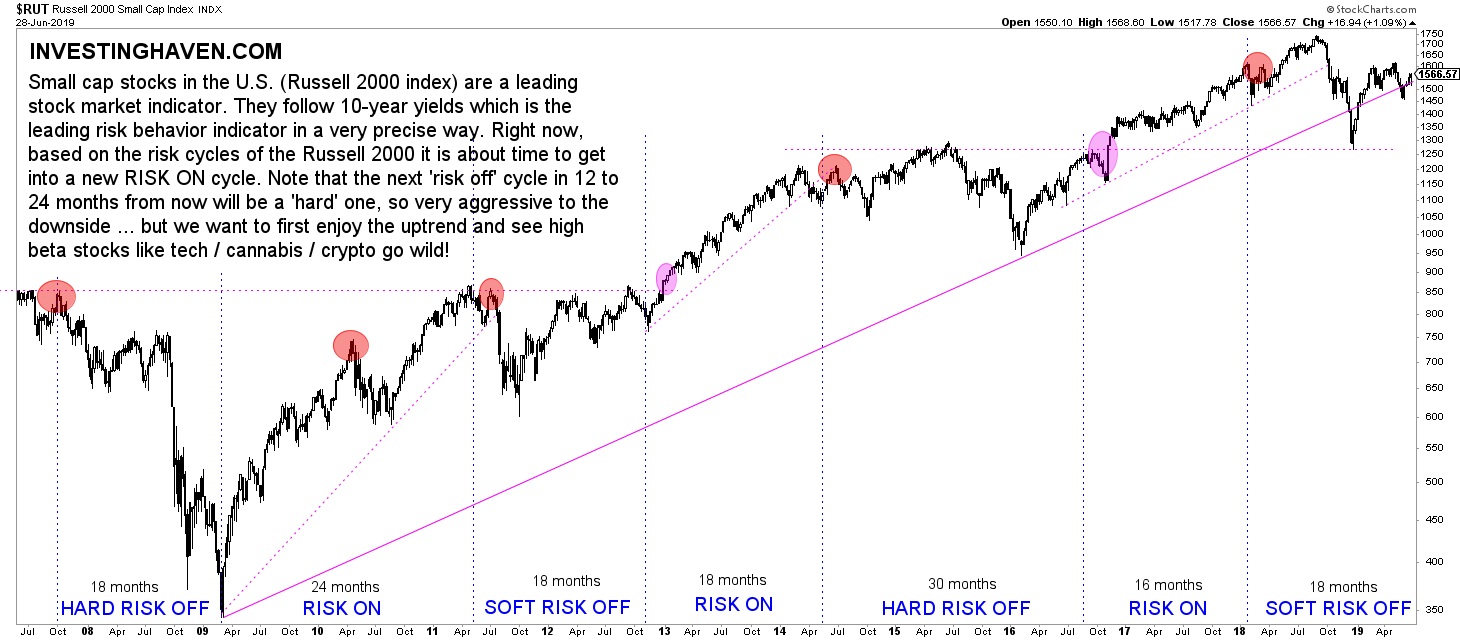
Second, the Russell 2000 which is our leading indicator for U.S. stock markets is about to end its current risk-off cycle. This is a chart observation to be clear.
Note that we are saying we do NOT look into the S&P 500 chart nor the Dow Jones chart. Many analysts are so focused on those indexes and try to analyze stock markets based on those indexes. We do not even look at them, let that be clear!
The Russell 2000 plays an important role in the trend of global stock markets in 2020. It is also THE leading indicator for all other stocks in the U.S., and partially also for other stock markets worldwide.
Below is our proprietary chart with proprietary cycle annotations. We see that the last 18 months were characterized by attempts of the Russell 2000 to stay on par. Essentially it was trendless, it did not go anywhere.
Note how this natural cycle of risk-on vs risk-off is consistently working for more than a decade now. Also, note that risk-off periods are alternating hard vs soft (this means that ‘hard risk off’ cycles have aggressive lower prices, even outright crashes, while ‘soft risk off’ periods are more flat with some short and not very ugly sell offs).
This chart and its cycles suggest a new risk-on cycle is brewing PROVIDED the Russell 2000 respects support at 1500 points and certainly does not dip below 1300 in 2019!
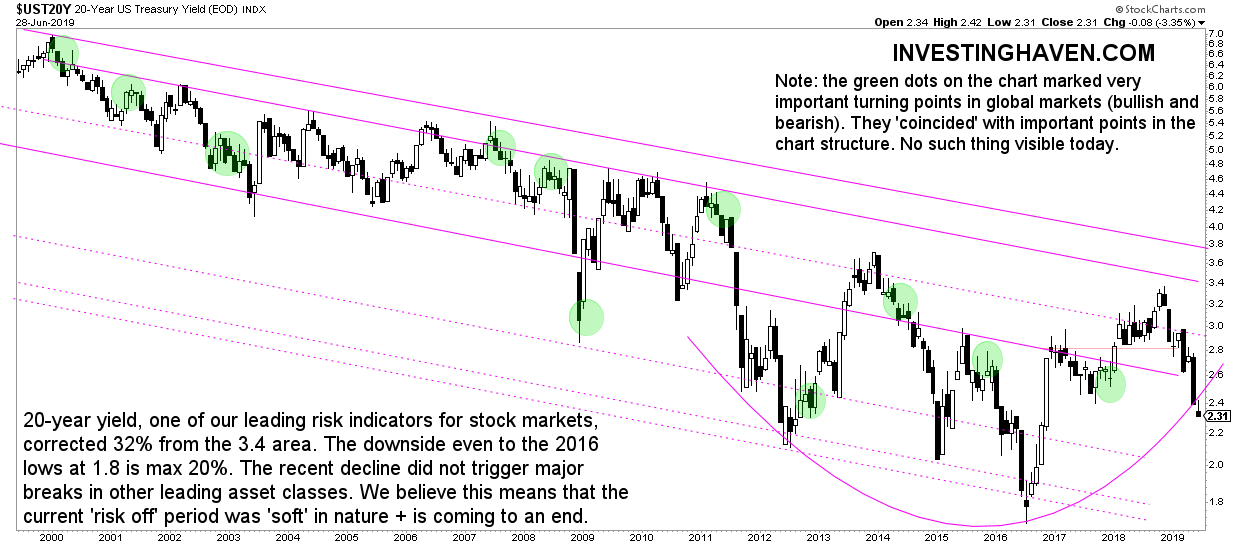
Third, another leading indicator, the 20-year Treasury rates.
This is a tricky one as we should be moving from a falling rate period into a totally new era of rising rates. This is a process though, and new rules may be written, but it takes time. That’s why we consider this chart tricky right now.
The most intuitive way to interpret this chart? Rates have fallen 32% in 2019 which is likely the biggest part of the decline. There is solid support around current levels. Even if the decline will continue it seems to be capped around 20%.
What’s the point about this?
We believe we are saying that the impact created on other markets will be limited even if the correction continues. We have seen limited impact of the recent 32% decline on other markets which makes us think that its effect has been largely absorbed.
This implies that we see a few months of volatility in global stock markets, and once Treasury markets stabilize we will start seeing a new uptrend in global stock markets!
Going into 2020 we see a bullish trend in global stock markets. When is our investing thesis invalid? If the ongoing Treasury decline continues, even accelerates, and takes stocks into its decline! There is a low probability of this to happen at this point in time!