Since the 2023 banking crisis started heating up, a month ago, we identified one specific chart that would determine whether a stock market crash would occur. Just one week ago, this crash indicator was on the verge of an epic breakdown. In the last 5 trading days, the situation changed drastically.
The ‘crash indicator’ we covered in March is XLF ETF.
The XLF ETF tracks the performance of financial stocks in the S&P 500 index. As such, it can be seen as a leading indicator for the broader stock market, as the financial sector is a key driver of economic growth and investor sentiment.
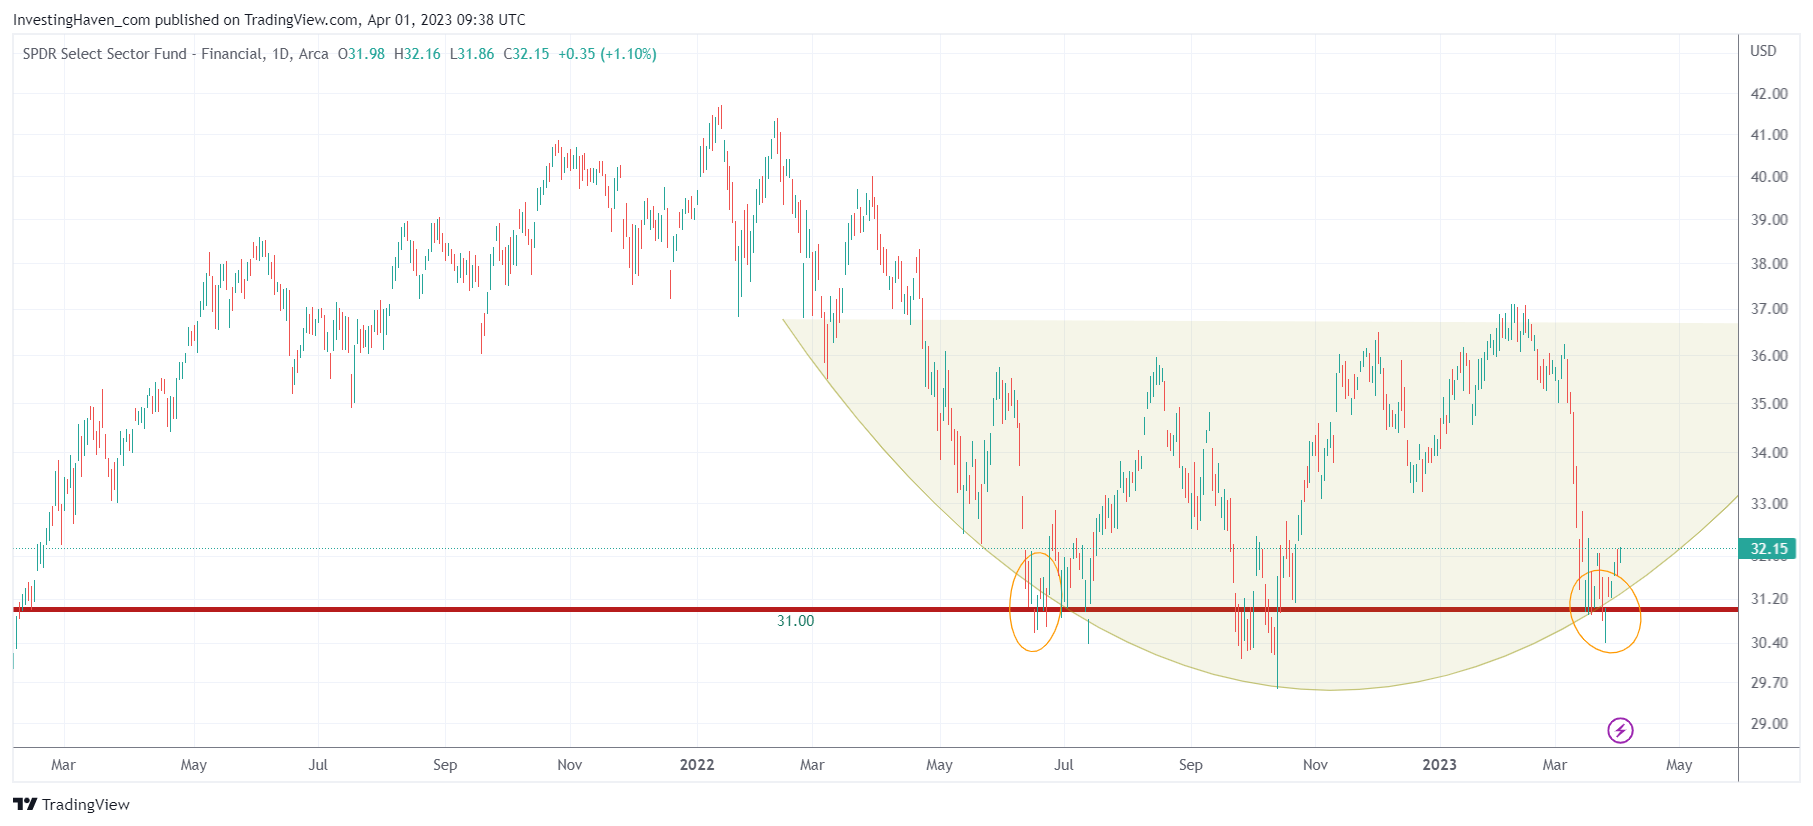
Looking at the chart of XLF, we can see that it has been trading in a range between approximately 31 and 34 points since mid-2022. This range-bound trading can be attributed to several factors, including concerns over rising interest rates and inflation, which could impact the profitability of financial companies.
However, what is particularly noteworthy about the XLF chart is the triple bottom that occurred at the 31-point level. A triple bottom is a bullish chart pattern that suggests that a support level has been established and that prices are likely to move higher in the future. In this case, the fact that 31 points held as support suggests that there is strong demand for financial stocks at this level.
It’s also interesting to note that the 31-point level was thoroughly tested, and was on the verge of giving way, before the Federal Reserve stepped in and provided unlimited funds to the banking sector. This intervention helped to stabilize the financial system and prevent a crisis, and also provided a boost to the stock market as a whole.
Overall, the fact that the XLF ETF held the 31-point level and formed a triple bottom suggests that the worst may be over for the financial sector and the broader stock market. This could be an indication that markets have started a new uptrend, as investors become more optimistic about the economic recovery and the prospects for financial companies.
Of course, it’s important to remember that the stock market is always subject to risks and uncertainties, and that nothing is certain in the world of investing. However, by using XLF as a leading indicator, investors can gain valuable insights into the health of the financial sector and the broader economy, and make more informed investment decisions as a result.
In the meantime, our Momentum Investing portfolio is starting to enjoy the positions we took in March.