
The US Dollar price performance is a hot topic amongst investors these days. We all saw the price climb up, the pressure it was putting on metals, a pressure that eventually spread to the cryptocurrency market and other asset classes. It is very easy right now to fall into the trap of the narrative which is one of the 7 most important investing lessons: Narratives create tremendous bias. Currently, the inflation narrative is pushing everyone to the USD and out of risk assets. While this narrative may become very profitable it remains a narrative. Remember, the charts have the answer, not our brain!
Recently, we covered the US Dollar price performance and the intermarket dynamics during the last two years. This assessment uncovered that the intermarket dynamic was off especially during the last 12 months, making it hard to forecast the next move for many asset classes. We also concluded that the move upwards in the USD seems exhausted.
After the last move upwards in the US dollar, do we still believe the USD has peaked for 2022? What price levels should investors keep an eye on? This is exactly what we will be covering in this article today.
US Dollar: The Roadmap is Crystal Clear on this secular chart
Before looking into the chart, let’s talk about patterns first. What is a pattern exactly?
Formally defined, a pattern is a set of relationships that are satisfied by observations of a system or a collection of systems.
So just like we look for patterns in the price action, we also look for the patterns when we assess how different asset classes interact with each other. Those key “relationships” that can trigger the big moves in markets and in portfolios.
Success in investing comes from understanding those patterns, building a system to “catch” those moves and remaining objective and flexible while managing the trade. This is something that comes with time but very achievable with practice. Our Bullish USD call in February 2021 is a good example of how success is achievable in investing with the right approach.
Just like we spotted the bottoming price action in the USD early and shared with our Momentum Investing members, we are now early to spotting a toppy price action at these levels.
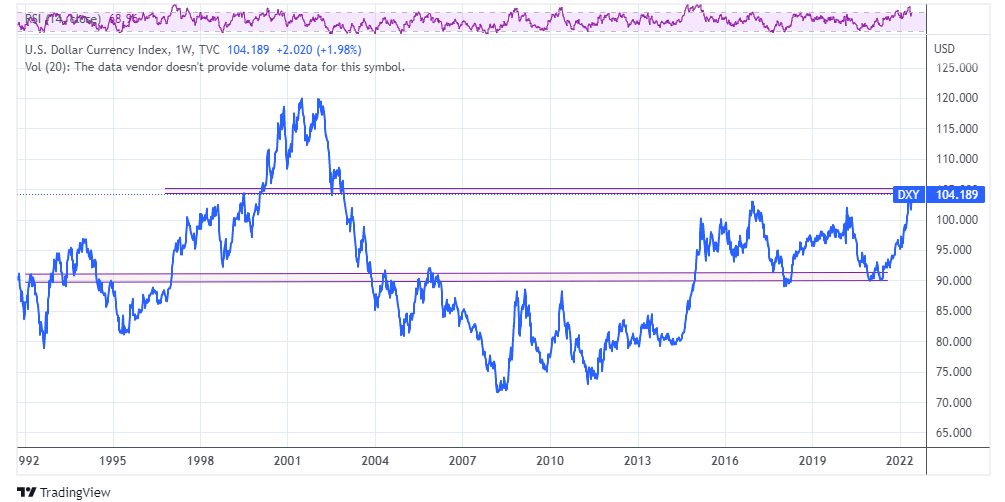
Findings From The US Dollar Long Term Chart
This very long term US Dollar price chart shows rather clearly how $105 is a very strong resistance level. But let’s say the price breaks out from there, well there another strong resistance at the $110 and an even stronger resistance in the $120 area.
The path for the USD Dollar is pretty clear based on this chart:
- The first and more likely path is towards a back-test of that $90 support
- A breakout above that important $105 resistance, pullback at $110 and if $105 acts as support we can see the price test that $120 area. This will mark the beginning of a new horizontal channel between $105 and $120.
- An in-between scenario: the USD price pulls back at $105 where 98-100 acts as support for an undetermined period of time before price clears $105.
Those are the 3 scenarios for the US dollar price that investors should continue to monitor as we enter the second half of 2022 and head into 2023 late this year.
Written by hdcharting, reviewed by Taki Tsaklanos


