The price of copper (COPPER) has been acting strongly in recent weeks. The million dollar question is whether this is a buy.
Copper rose from $2.51 early June to close the month at $2.71, a gain of 8 percent. The copper price rally was noticed by all financial media, like Bloomberg and Forbes.
The chart on Bloomberg’s site had a commong pitfall: it showed a pattern on the daily chart but did not reveal the bigger picture pattern.
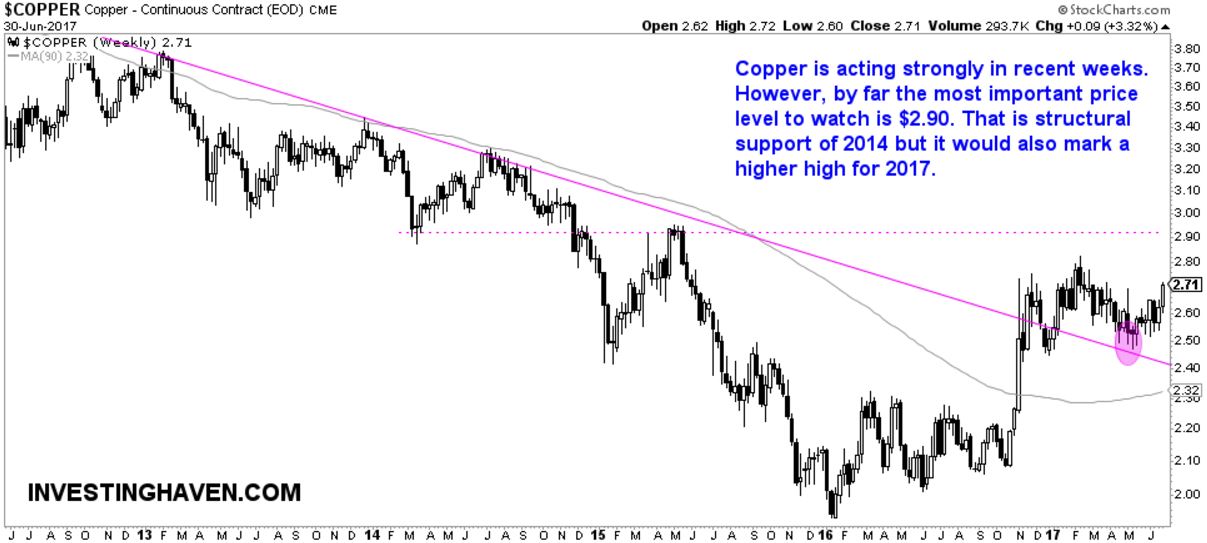
The weekly chart provides the best insights in order to understand how attractive copper is. A couple of observations stand out on this chart:
- Copper broke out last November. InvestingHaven provided extensive coverage in that period of time, with real time alerts like Copper Price At Secular Breakout Point and The Copper Price; Moment Of Truth For Investors.
- It continued its rise until February of this year, where it topped right below secular resistance (support of 2014 and the peak of 2015).
- Since then, copper basically consolidated. However, it remained strongly above its breakout trendline.
The move in recent weeks does not tell anything in the ‘bigger scheme of things’. No support levels broke neither did any resistance level break. So copper continues to consolidate between $2.80 and $2.50.
The ‘real deal’ is $2.90, for two reasons:
- Once copper goes to $2.90 it would be a higher high for the year. That is bullish.
- The $2.90 level is resistance of 2015 and support of 2014. In other words, $2.90 is a meaningful price level. Price action at $2.90 will be the ultimate indicator for a bullish or bearish forecast for the coming 12 months.
Until then, we stick to our Bearish Base Metals Forecast For 2017.
Intuitively, one would think of Freeport-McMoRan (FCX) as a leveraged play for a rising copper price. However, traditional leverage is not in play any longer. FCX has risen some 10 percent in June, similar to the price of copper. Copper miners are not really leading so that is a red flag in our view.