The price of gold has acted strongly in the first months of 2018. Right now it is undergoing a retracement. InvestingHaven is on record with a gold price prediction for the short term, say in the next 3 to 6 months, which is, surprisingly, bullish. Our short term gold price prediction is based on the Commitment of Traders report which is essentially the positions of large market players in gold futures market.
A bullish short term gold price prediction
We already made the point earlier that the Gold Price has an Explosive Upside Potential Once It Moves Back Above 1300. We consider the $1300 level an important area, and, as said before, once the gold price goes for 3 to 4 consecutive weeks above the $1300 to $1325 area it will generate a strongly bullish energy in the gold market.
Note, though, that we were not very bullish until late last year. We are fully transparent with our change in stance somehow after we wrote our Gold Price Forecast For 2018. Also, our Gold Price Forecast For 2017 was bearish (the latter was an accurate prediction by the way).
What made us change recently?
Very simple. Not only the chart setup but, more importantly, our inflation expectations indicator moving steadily higher, close to a secular breakout point, as well as the positions in the gold futures market (which can be found in the weekly Commitment of Traders report, in short CoT).
Let’s zoom in for a second on the CoT, and how it allows us to do a gold price prediction.
First, the CoT is not a good timing indicator. It does not allow to predict a price movement on a certain point in time. It does, however, suggest the direction.
As seen on the chart below, with lots of annotations made by InvestingHaven’s research team, the trend is clear: there is a soft bull market, not as strong as in the 2010-period though. The positions of large gold futures trades which are shown in the center pane (blue and red bars) suggest the trend, and it nicely maps to the gold price (upper pane).
The orange bars indicate the first 6 months of each year. Visibly, during bull market, regardless the level of strength of the bull market, it is a recurring pattern that the gold price goes up in the second part of the year, especially in the first 3 to 4 months (July to October). This gold price pattern (upper pane) is associated to rising to futures positions of large market participants (center pane). The key to watch is the level of extremeness (long or short) in futures positions: right now, we are moving to a relatively low level in futures positions (watch the 100 level in the center pane).
Admittedly, there is downside potential in both the gold and silver price right now. That will bring the futures positions down, most likely to an extreme low level. But, somewhere in the second part of July, we anticipate a strong move higher in the gold price.
This short term gold price prediction is likely going to trigger a secular breakout on the long term chart which is the cornerstone of our bullish gold price prediction. To the best of our knowledge by September of this year we might be looking at a breakout in the gold market.
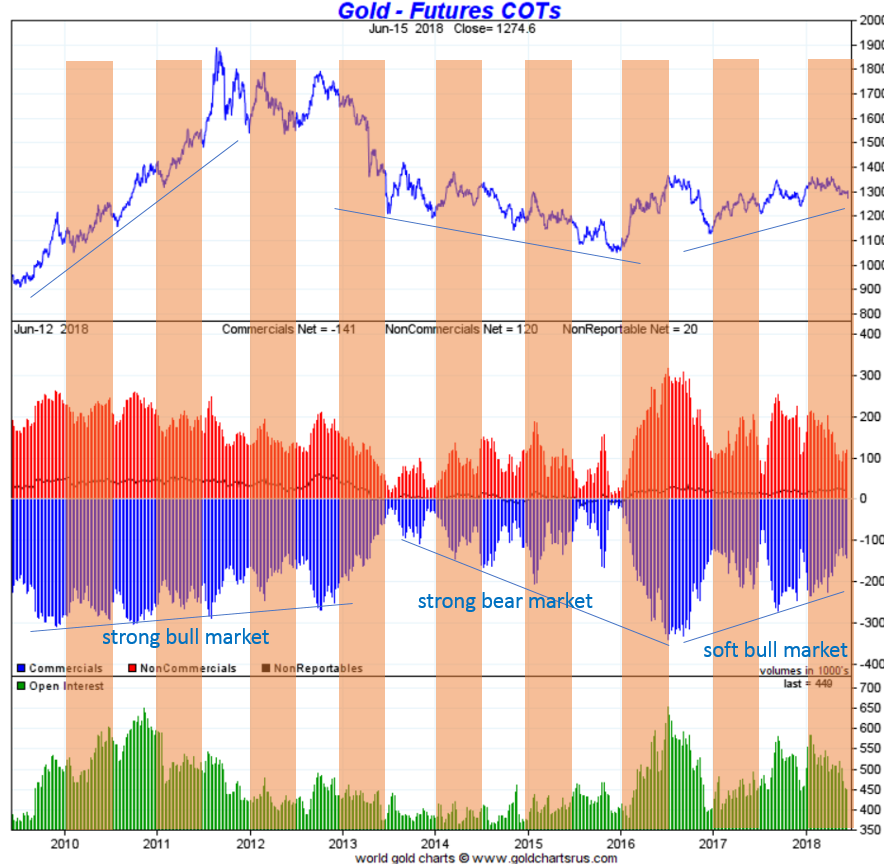
Chart courtesy: Goldchartsrus


