The price of gold (GOLD) retraced since February. There is another 8 months in 2019 for gold to move in the direction we predicted in our annual gold forecast. The long term gold charts still look very constructive, and top gold stocks may become super bullish when sentiment becomes bullish again. That’s the nature of the gold market: when nobody pays attention … And we believe 2019 will be such a year. We still expect a sudden strong move right at a time when nobody is paying attention. The probability of gold and precious metals stocks to qualify as a top 3 investing opportunity in 2019 is still reasonably high.
Fundamentally, nothing has changed in the gold market as its price retraced in recent weeks. The only thing that changed is intermarket influences primarily from interest rates and currencies as well as the technical picture in the futures market and on gold’s chart. Let’s revisit those ‘influencers’.
That’s why we don’t really agree with this analyst on Barron’s who says that the stock bull market will not favor the gold market. We have seen times in which gold was rising along with stocks, that’s part of investing insights 101.
Gold Price Leading Indicators
First, the intermarket influencers.
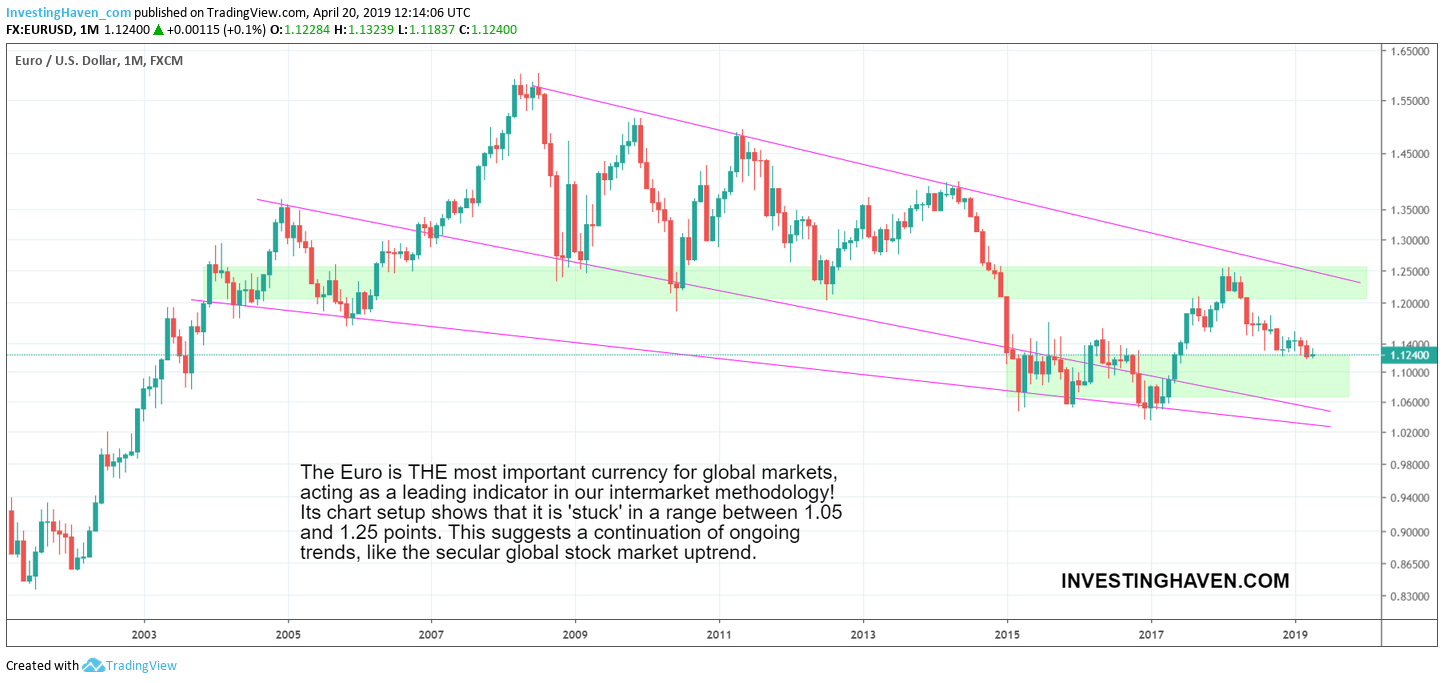
As said in our gold price forecast the Euro is by far the most important leading indicator for gold. Both are positively correlated, not necessarily on a day-by-day basis but more in the context of the direction in their secular trends. It’s a directional relationship.
The Euro does not seem to provide much resistance to gold. We also tend to call this ‘stopping power’. In case the Euro would sell off strongly it would be bad for gold. We don’t see this happening, primarily because the Euro is pretty close to secular support.
Gold Futures Market
Second, gold’s futures market.
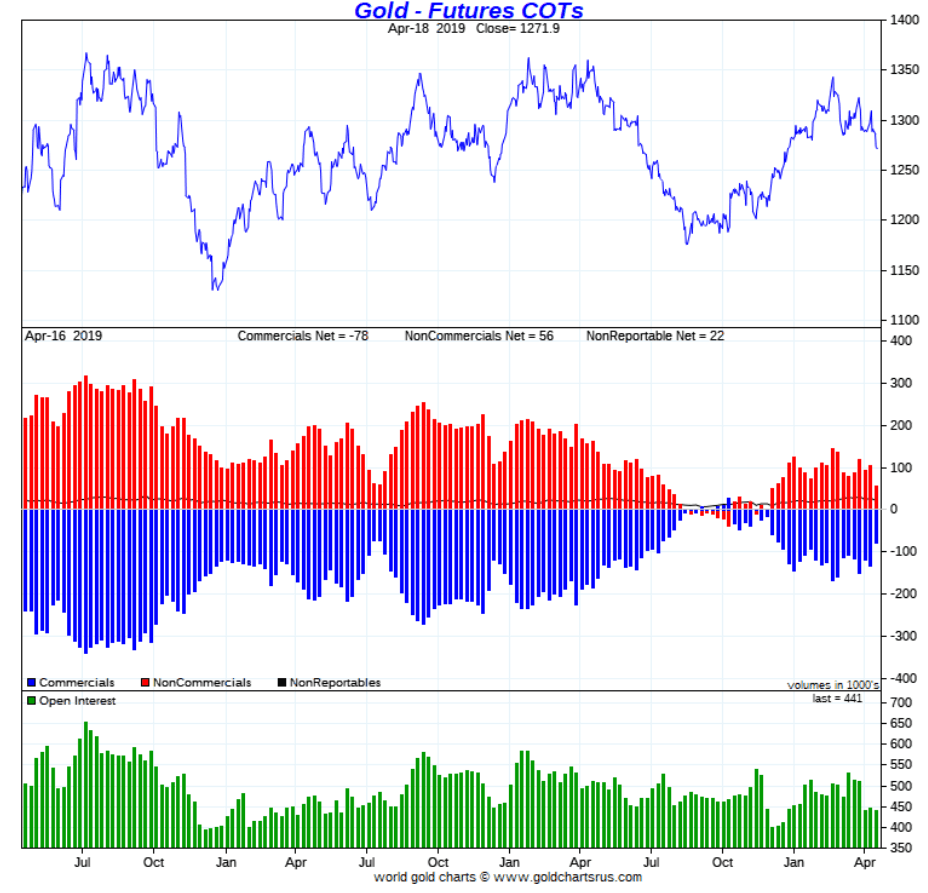
The Commitment of Traders report of gold finally shows a retracement in the positions of futures market participants. Again, it’s about stopping power especially when there are extreme positions.
The positions of non-commercials are falling significantly. Collectively, they hold net 56k futures. This is moving to an extreme situation in favor of the gold price.
This is not a timing indicator. But extreme measures indicate that the price of gold is close to a turning point. We believe there is less downside potential in gold, and much more upside potential. The turning point may take a few months to materialize, we don’t know.
Gold’s Price Chart
Third, gold’s chart.
The gold chart looks still constructive. The series of higher lows over the last 3 years is in tact, the uptrend since last summer is still in tact. And the chart is a function of the next attempt to break through this giant stubborn gold bear market wall at $1350.
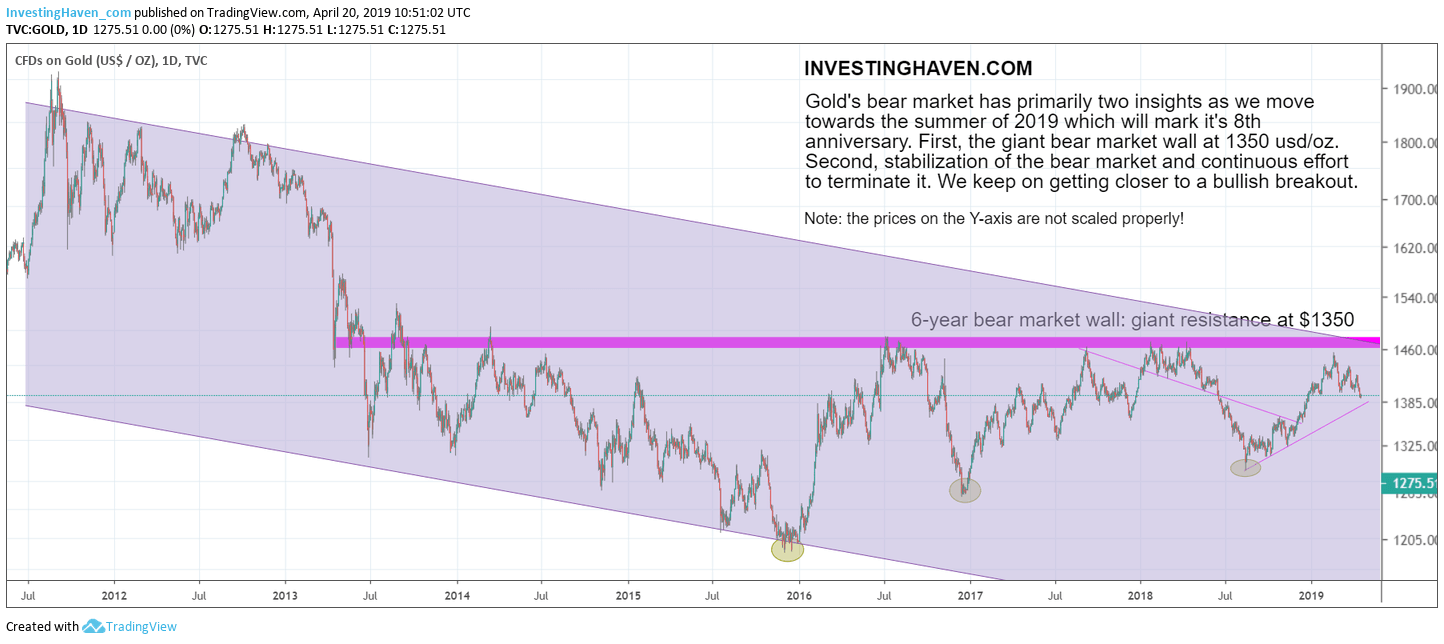
Consequently, we believe it is a matter of time until gold is back in vogue.
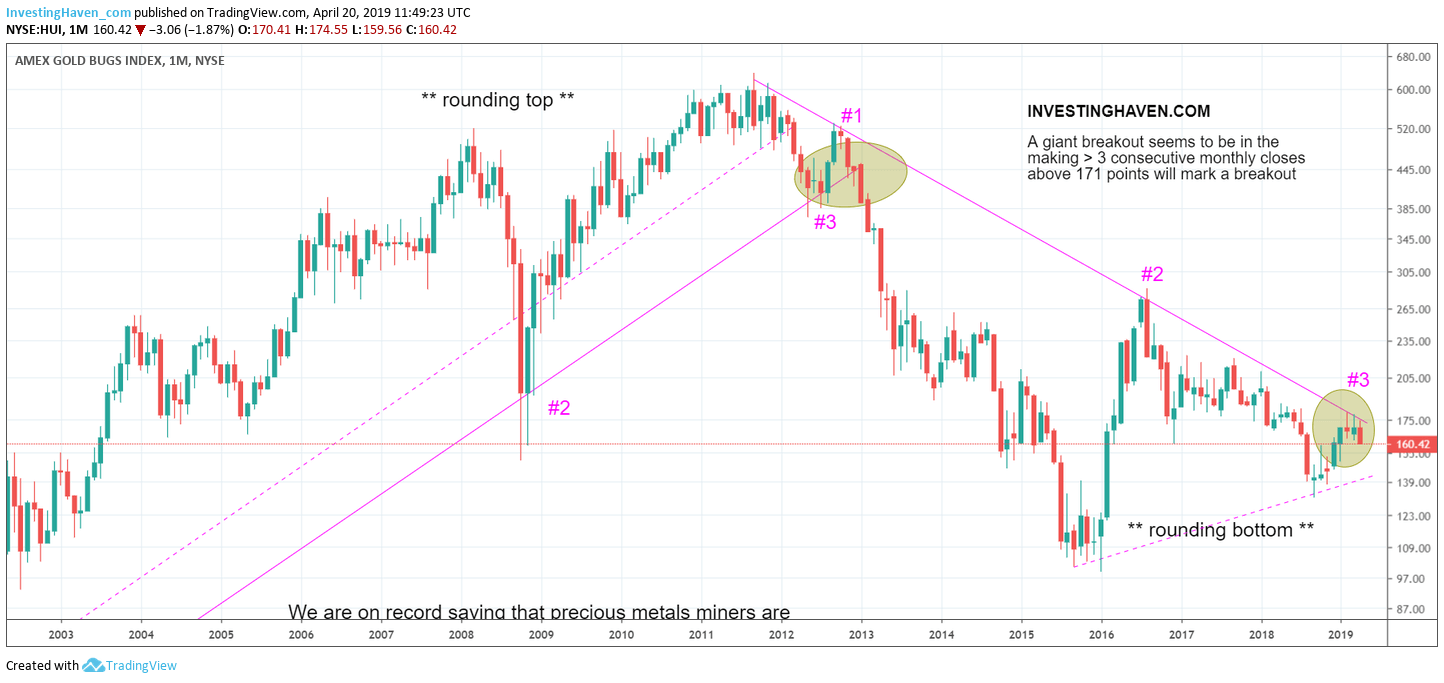
Gold and silver stocks as per the HUI index gold miner index logically retraced after it peaked in February. There is obviously a direct and strong correlation with the price of gold.
Chart-wise, gold stocks now look ready to fall another 10 pct. But watch how momentum is building up in this space. Any break out of this giant apex as part of this giant triangle shown on below chart will result in a major move. The odds favor a big move up.
Patience is required.