Our palladium forecast for 2020 was pretty straightforward. We said that our palladium forecast is either super bullish or very bearish with price targets of either $2,500 or 1,300. With the palladium price explosion of recent weeks we are now 10 pct below our bullish 2020 price target. Time to prepare an exit, not to add to positions, is what the quarterly palladium chart suggests. Note that other precious metals may be in a different stage in their bull market, especially gold and silver are in an emerging bull market as said in our gold forecast as well as silver forecast.
Below is the palladium chart we have been using for a while now. We also featured the notes on the chart a year ago, we did not change anything on this chart other than extending the trendlines till the present day.
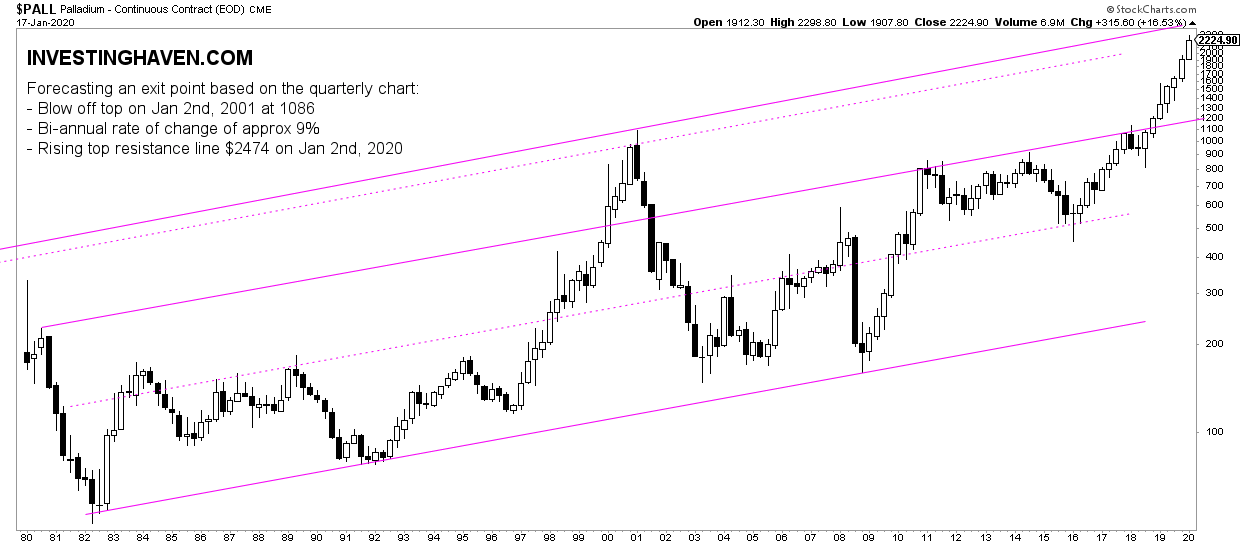
The important note on the palladium chart says forecasting an exit point based on the quarterly chart:
- Blow off top on Jan 2nd, 2001 at 1086.
- Bi-annual rate of change of approx 9%.
- Rising top resistance line $2474 on Jan 2nd, 2020.
What this really means is that we calculate the top of the trendline based on a few price points in the last 2 decades.
Based on this calculation we see that currently approx. $2500 coincides with the resistance point.
What’s very important to understand is that we had to take the longest possible timeframe to conclude that we are near an exit point when palladium comes closes to $2500 in the next few weeks/months. This is certainly not visible on lower timeframes.
That’s why it is important to always take a top-down approach when charting an opportunity.
Why do we stress this? Because we thought to get out of our palladium position last April when this mini-crash took place. The monthly chart suggested a major peak. However the quarterly chart which is the one featured in this article merely showed a continuation of the bull market.
Every investor has to learn, constantly. We are transparent enough to admit that we missed something in the past, and we always keep all our articles published even the ones in which we made a mistake.
The golden learning for any investor, especially commodities investors: include the quarterly chart in your top down charting approach (quarterly/monthly/weekly charts are mandatory).