Our gold price prediction for the coming years remains firmly bullish. Some periods of weakness characterized by gold price pullbacks can be expected. Gold price targets: $4,200 in 2025, near $5,400 in 2026, peak gold price prediction of $6,200 by 2030.
November 2025 – This gold article is now up to date with the ‘latest and greatest’ gold price charts:
- Gold chart over 20 years (stunningly bullish).
- Inflation expectations chart – strongly correlated with gold (hint: bullish).
- Gold price to inflation expectations ratio (must-see chart).
- Gold chart over 50 years – a potential bearish pattern is being invalidated
We strongly recommend to check the latest gold charts in this article.
They are worth your time and attention, especially since this article including charts are very well researched.
Gold price prediction – outline
The summary of our gold price prediction is presented the first section of this article. The remainder of this article provides a deep understanding of the true dynamics driving the gold price.
- 1. Gold price prediction 2025, 2026, 2027, 2030: a summary.
- 2. Gold price breakout in all world currencies.
- 3. Gold price charts: long term charts.
- 4. Gold bull market: monetary dynamics.
- 5. Gold price fundamental driver: inflation expectations.
- 6. Gold price leading indicators: currency & credit markets.
- 7. Gold price leading indicators: the futures market.
- 8. Gold price predictions: an overview.
- 9. Gold or silver? Or both
- 10. Gold predictions by institutions
- 11. Gold predictions FAQ
We start with a quick summary of our gold price prediction and continue presenting the extensive research of how we got to these gold price predictions.
1. Gold price forecast for 2025, 2026, 2027, 2030
This is the outcome of our gold price prediction analysis outlined in the remainder of this article.
- 2025: max gold price right above $4,200.
- 2026: max gold price around $5,000.
- 2027: max gold price around $5,600.
- 2030: peak gold price prediction $6,200.
The ranges indicated in this summary are estimates produced by InvestingHaven’s research, based on current and predicted intermarket trends and secular gold charts.
Gold’s bullish thesis invalidates once it drops and stays below $3,000, which represents a strong pshycological support level.
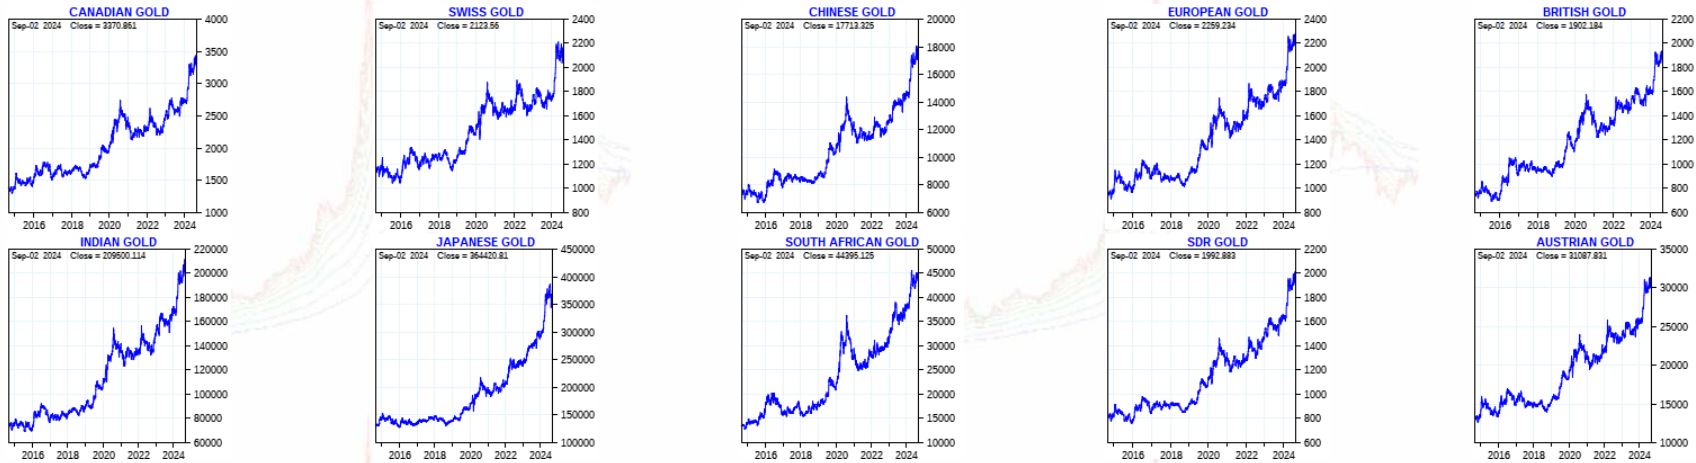
2. Gold price breakout in all world currencies.
Most gold price forecasts are U.S. centric which means gold expressed in USD.
What many investors don’t realize is that gold started setting new all-time highs in each and every global currency as evidenced by this magnificent chart (courtesy o Goldchartsrus).
This process started early 2024. It was the ultimate confirmation of the gold bull market.
3. Gold price charts: long term charts.
We take a top-down approach: from the 50-year gold chart exhibiting dominant secular dynamics to the gold price over 20 years for medium term oriented dynamics.
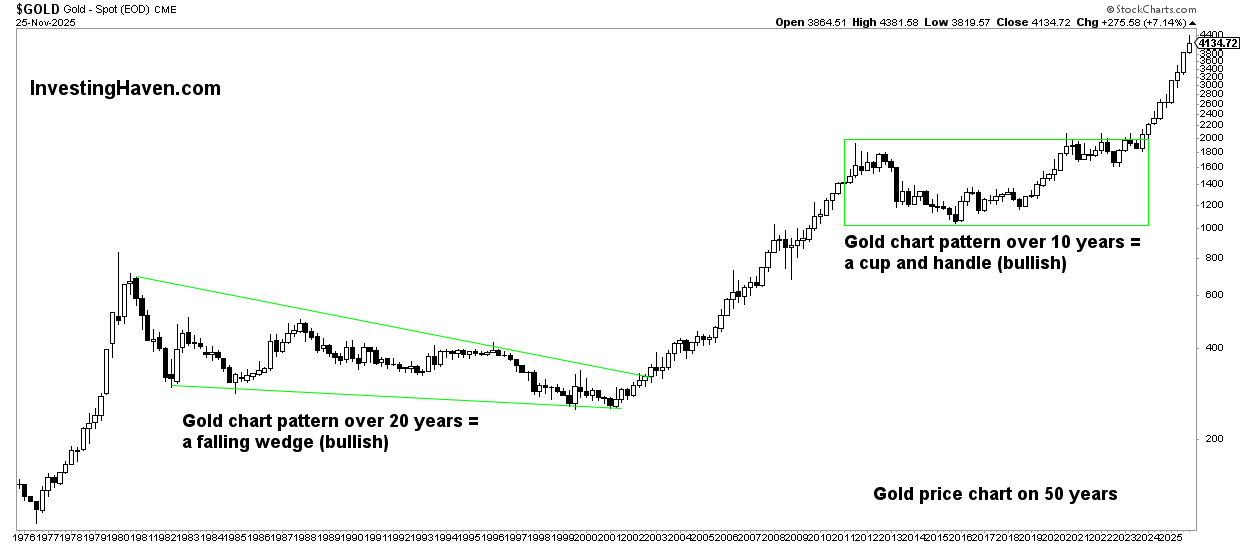
Gold chart over 50 years – the bullish case
The 50-year gold chart in USD shows 2 secular bullish reversal patterns:
- In the 80s and 90s – a long falling wedge. This was such a long (hence strong) pattern that the subsequent bull market was unusually long.
- Between 2013 and 2023 – a secular cup and handle formation.
The recent 10-year bullish reversal is powerful.
As said, ‘long’ equals ‘strong’ when it comes to consolidations and reversal pattern. This creates a strong argument for a strong gold bull market in the years to come, with a high confidence level.
The secular gold chart suggests that the gold bull market will run over multiple years.
November 2025 – Gold’s long-term chart shows a powerful bullish trend, with the recent breakout completing a decade-long consolidation. This reinforces a strong gold trend and supports a constructive gold price forecast. The chart’s structure suggests a continuation of the multi-year uptrend, strengthening the broader gold prediction outlook.
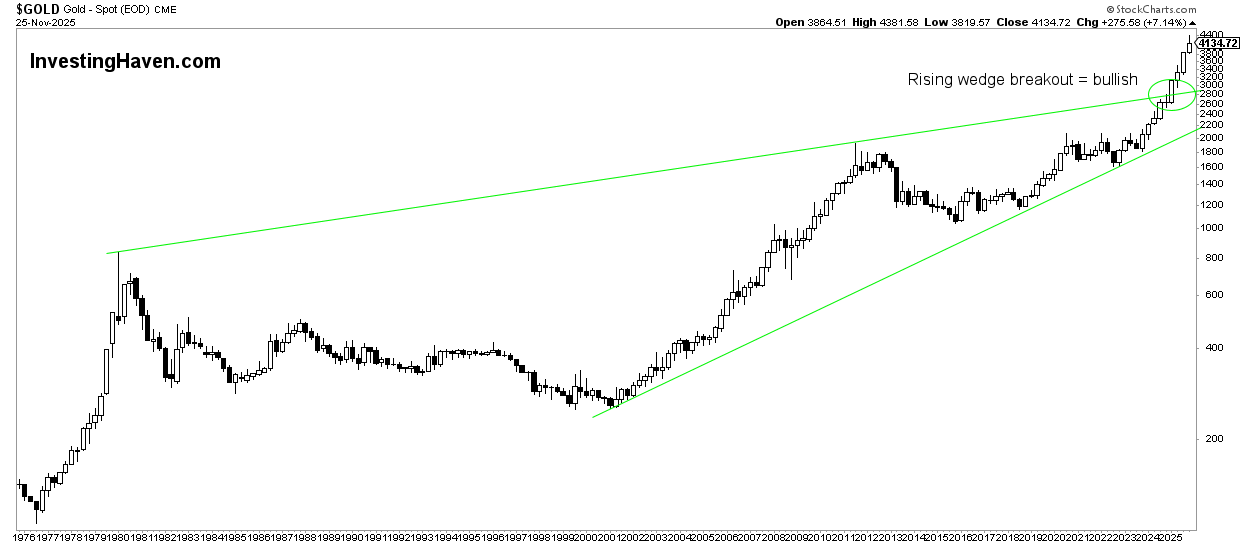
Gold chart over 50 years – the potential bearish case (entirely invalidated)
The long term gold chart structure shown below has a very different looking compared to the same chart with different annotations shown above:
- Below is a rising wedge which by definition is a bearish pattern.
- However, this is in contrast to the strongly bullish pattern on the above shown chart.
- A bearish outcome will occur if gold leaves a large wick on its quarterly candlestick chart (below) similar to the ones in 1980 and 2011. This is not the likely outcome, as gold only rose 30% after its breakout in April of 2024 (in 1980 and 2011, it went up triple digits before hitting a big top).
We always need to be mindful of the two sides of the trade, no matter how unlikely some outcomes may be.
How to Invest in Gold with eToro
Looking to benefit from the current gold trend and your gold price forecast or prediction?
With eToro you can get exposure to gold in just a few clicks.
- Open a free eToro account and complete verification.
- Search for “Gold” or related instruments on the platform.
- Decide your position size, set risk parameters, and place your trade.
Start Investing in Gold on eToro
Disclaimer: 61% of retail investor accounts lose money when trading CFDs with this provider. You should consider whether you can afford to take the high risk of losing your money.
November 2025 – Gold Market Update (Q4 2025): Gold’s breakout above $4,100 confirms a powerful bullish structure and strengthens the long-term gold trend. This supports an optimistic gold price forecast and reinforces a constructive gold prediction. With former resistance at $3,200–$3,450 now acting as firm support, gold has entered a renewed momentum phase driven by multi-year chart strength.
The current gold trend remains convincingly bullish as long as price holds above the breakout zone. The gold price forecast benefits from continued USD weakness, a key driver in this gold prediction. Persistent pressure on the dollar typically accelerates upside in gold, making USD data essential to watch
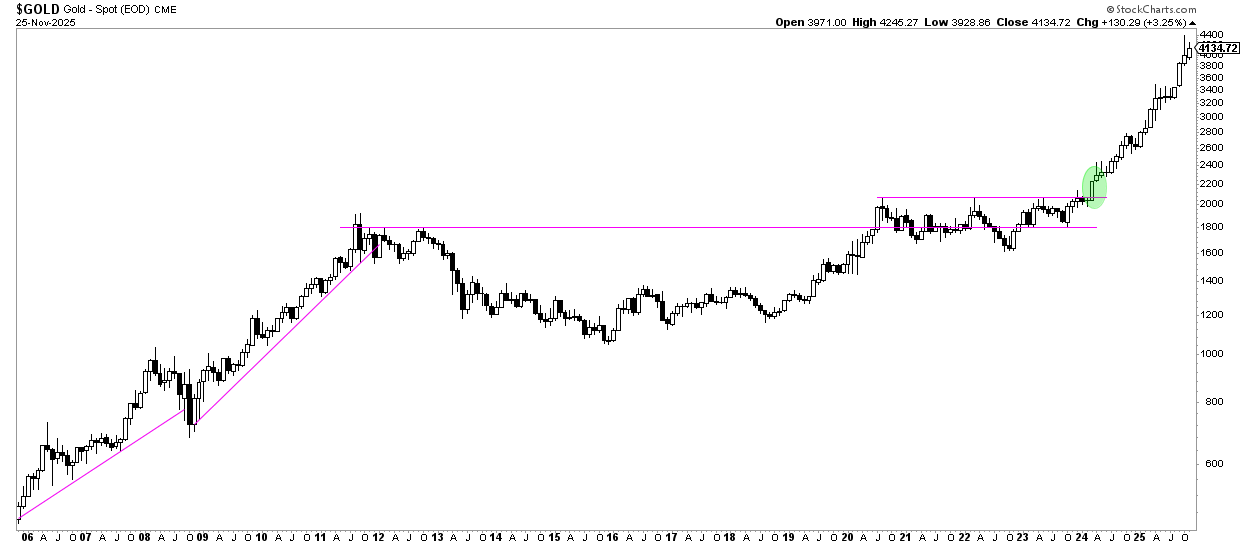
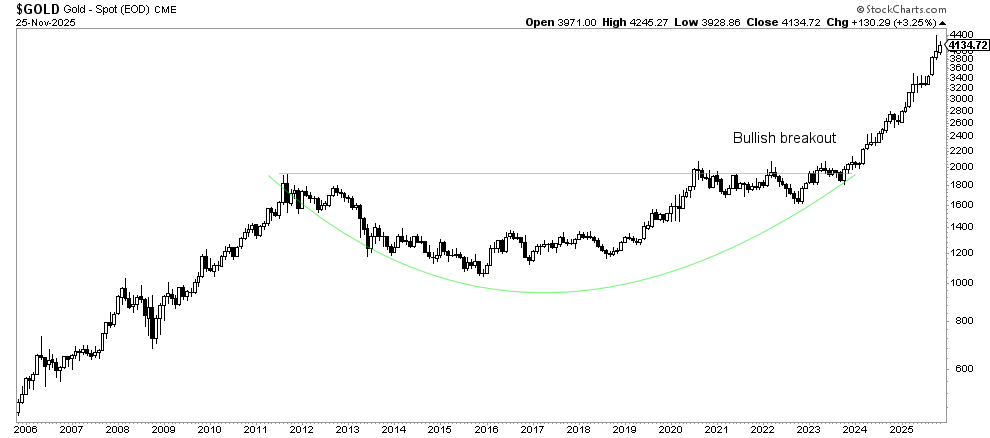
Gold chart over 20 years – the VERY bullish case (must-see chart)
The 20-year gold chart setup:
- A gold bull market tends to start slowly and accelerate towards the end.
- The last gold bull market experienced three phases.
The bullish cup and handle reversal between 2013 and 2023 suggests a multi-staged gold bull market going forward.
REMEMBER – History does not repeat, it does rhyme.
November 2025 – Gold related headlines in November 2025 are bullish on Gold:
- Goldman Sachs Hikes December 2026 Gold Forecast to $4,900 (October 2025)
- Gold Steadies After US Jobs Data & Expected Rate Cut (November 2025)
ANZ raises year-end gold forecast to $3,800 per ounce (September 10th, 2025)
Why UBS just raised its gold forecast again as the precious metal hovers near record high (August 19th, 2025)
Although we emphasize to stay away from the news – it’s confusing!
Following recent headlines that we mentioned in previous iterations in this gold forecast, Gold went on to hit all time highs!
Gold relates headlines in September are firmly bullish:
November 2025 – The gold chart is very clear: it’s a gold bull market, a strong one. There is not a lot that can stop gold other than some temporary pullbacks.
Gold to inflation expectations ratio (must-see chart)
While the long term gold price chart shown above is bullish, there is one gold chart that is even more bullish.
The gold price divided by inflation expectations (TIP ETF) is wildly bullish.
Gold is rising faster than inflation expectations. This is a characteristic of a bull market similar to the one in 2005 to 2011. Moreover, the chart pattern on this chart is a bullish cup and handle reversal, a wildly bullish pattern.
November 2025 – The gold price to inflation expectations ratio continues its uptrend, now well above the critical 22 point level (see horizontal trendline on below chart). This ratio is trying to set new ATH, and this means one important thing: the gold bull market remains intact and is strengthening with each passing month!
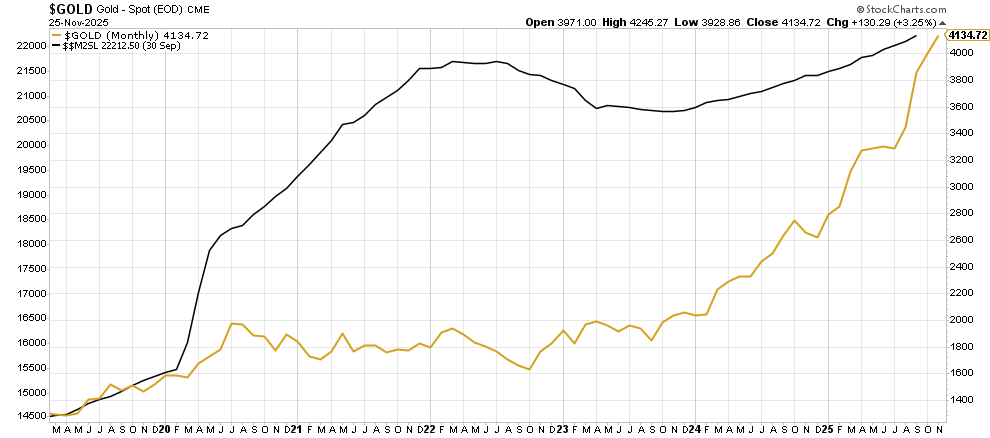
4. Gold bull market: monetary dynamics.
Gold is a monetary asset. It is driven by monetary dynamics.
As seen on below chart, the monetary base M2 continued its steep rise in 2021; it started stagnating in 2022.
Historically, we see that gold and the monetary base move in the same direction. Golds tend to overshoot the monetary base but mostly it tends to happen temporarily.
The monetary dynamic eventually pushed the price of gold so much higher in 2024; the divergence between M2 and the gold price was not sustainable.
The divergence did not last – we explained this in each and every of our recent gold forecasts – it appeared an accurate assessment.
Gold’s monetary dynamics reveal a powerful setup: safe-haven capital continues to rotate into precious metals, monetary conditions lean toward easing, and central banks maintain a steady accumulation trend. This convergence elevates gold’s strategic role in 2025, reinforcing its strength as a stabilizing force within the global financial system.
November 2025 – Gold did entirely catch up with one of its leading indicators: monetary inflation. We used the divergence on this chart, back in 2022, as our bullish gold thesis, at a time when common belief was for gold to enter a bear market. In hindsight, our gold price prediction appeared to be right, and so is the accuracy and relevance of our leading indicator readings.
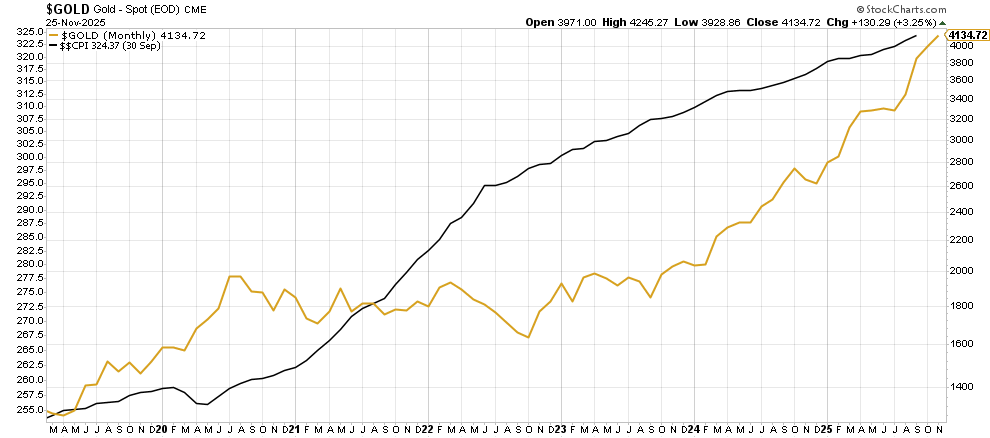
Similarly, gold tends to track the CPI (inflation).
The divergence between CPI and the price of gold was temporary.
We expect both CPI and the gold price to rise in synch in the coming years, underpinning a soft price uptrend in 2025 and 2026.
The CPI combined with M2 seem to be experiencing a stable growth. This will drive a soft uptrend in the price of gold.
November 2025 – Gold and CPI keep on rising ‘hand in hand’ as evidenced by this next chart. This correlation supports our long term gold price predictions simply because central banks aim for 2% annual CPI, (in)directly stimulating the gold price.
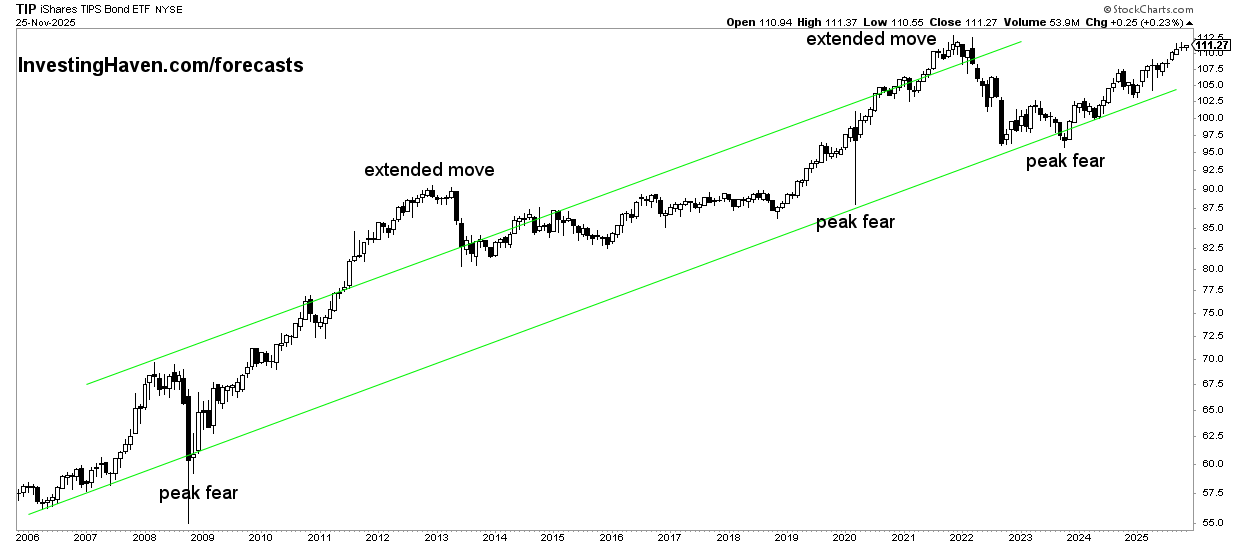
5. Gold price fundamental driver: inflation expectations.
By far, the most important fundamental driver of gold is inflation expectations. It’s the most important element of our gold price forecasts.
That’s because gold shines in an inflationary environment.
Many analysts believe that fundamentals of gold are related to supply/demand dynamics, economic outlook, recessions, and the likes.
We thoroughly disagree.
Our research has shown that inflation expectations is THE fundamental driver of gold.
Consequently, fundamental analysis of gold is based on inflation expectations (TIP ETF).
TIP ETF came down in 2022 which explains why gold was so volatile in 2022. The long term trendline was respected. Essentially, the next chart says it all.
November 2025 – Gold and TIP ETF keep on rising nicely together. In a way, the TIP uptrend shown below is leading gold higher. As long as TIP ETF remains within its rising channel (green trendlines), it creates an environment that is very supportive for gold.
Inflation expectations correlations with gold and stocks
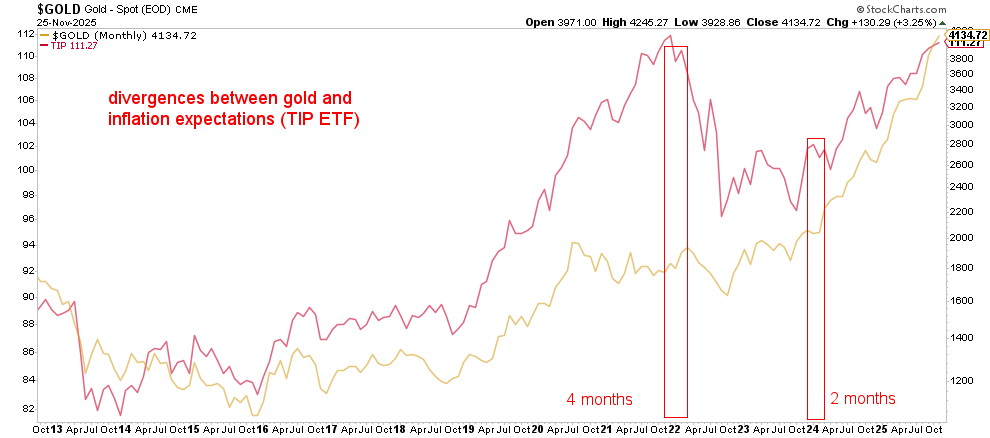
Historically, the price of gold and TIP ETF have been positively correlated.
Only exceptionally have both been diverging.
November 2025 – Historically, gold and TIP ETF tend to be positively correlated. They only temporarily diverge. As seen below, a rise in TIP ETF is the ultimate leading indicator for the gold price. This correlation chart, combined with divergences that only last max. 6 months (based on recent history), gives us confidence in long term bullish gold price predictions.
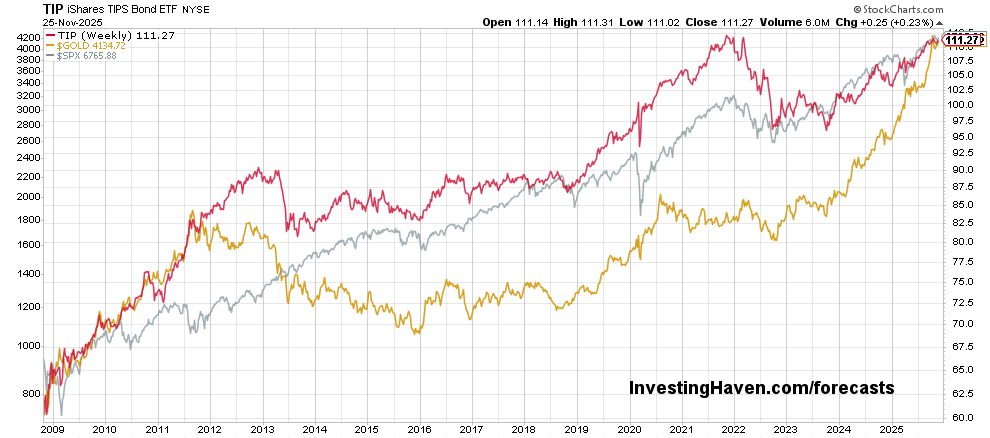
Interestingly, gold is strongly correlated with TIP ETF which is strongly correlated with SPX.
When we look at the historic relationship between TIP, gold and stocks, we can see how a decline in TIP has led to lower gold and stock prices. The opposite is true as well. This, eventually, is the ultimate answer to those that pretend that gold is thriving well during a recession; that’s not true and invalidated by below chart!
November 2025 – Gold, TIP and even the S&P 500 are positively correlated. Gold needs a positive market environment to thrive. This debunks the myth of gold needing uncertain economic conditions, below chart invalidates that thought.
6. Gold price leading indicators: currency and credit markets.
One of the two leading indicators for the price of gold price is an intermarket dynamic driven by currency and credit markets. In particular, gold is correlated to:
- The Euro (inversely correlated to the USD).
- Bond prices (positively correlated most of the times, not always though).
The message of the currency market
Gold tends to go up when the Euro is in a bullish mindset. Consequently, when the USD is rising it puts pressure on gold.
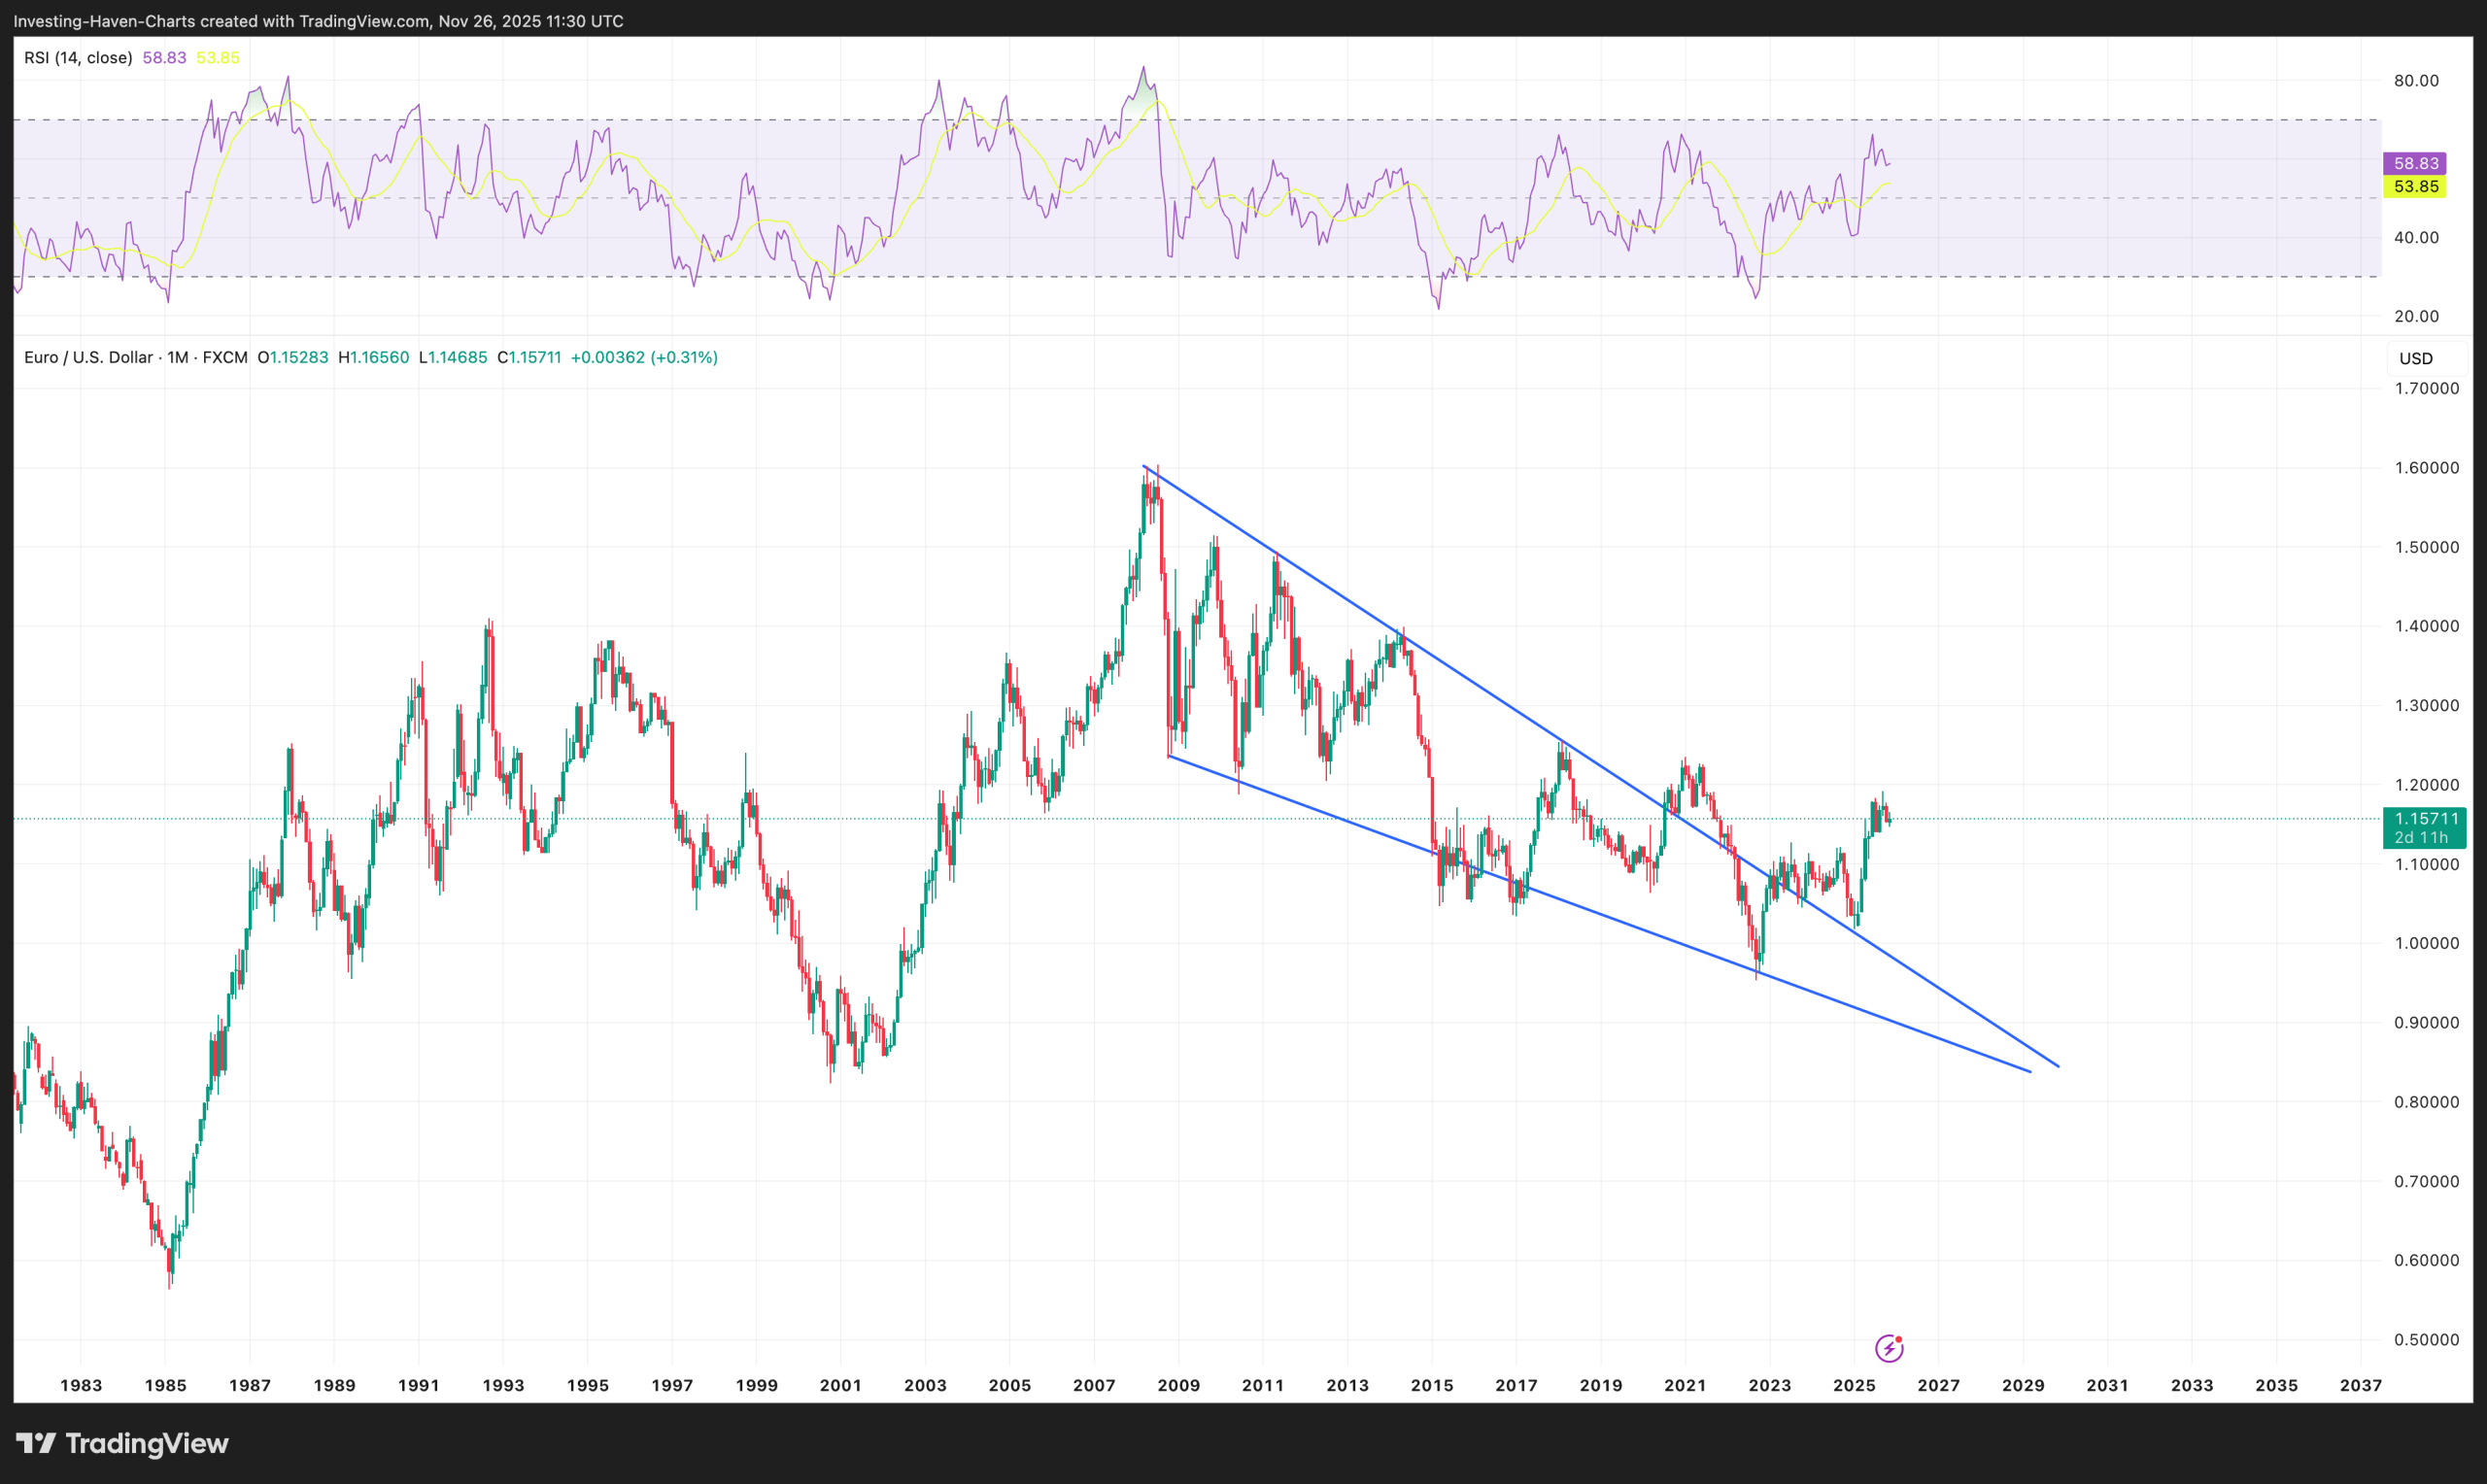
The EURUSD looks pretty strong here. This creates a gold-friendly environment.
November 2025 – The secular EURUSD chart is an important indicator for gold, especially at times when the EURUSD is in a secular decline. Back in 2008, 2013, 2022, the EURUSD noticed significant declines which resulted in large drops in the price of gold & silver. The rule of thumb, on the highest timeframe, is that the EURUSD should not be in a steep decline in order to create a supportive environment for gold & silver. At the time of writing this update, the EURUSD is struggling but not in a secular downtrend.
The message of the the credit market
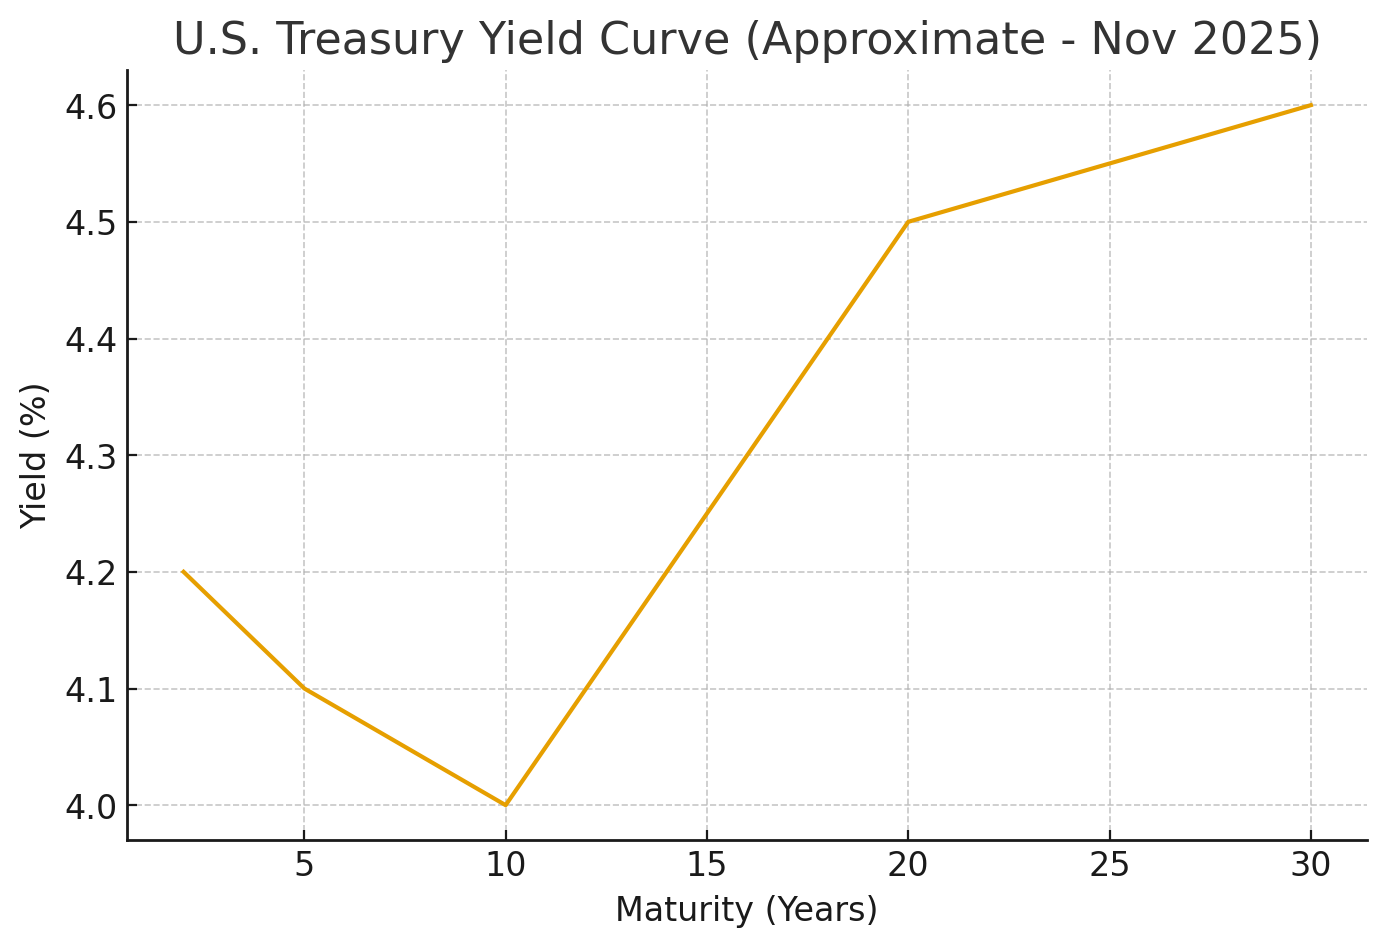
Treasuries are positively correlated to gold, bond yields are inversely correlated to gold.
That’s because of the effect of changes in yields on the net inflation rate.
With the prospects of rate cuts all over the world, it is expected that Yields will not move higher. This is supportive for gold.
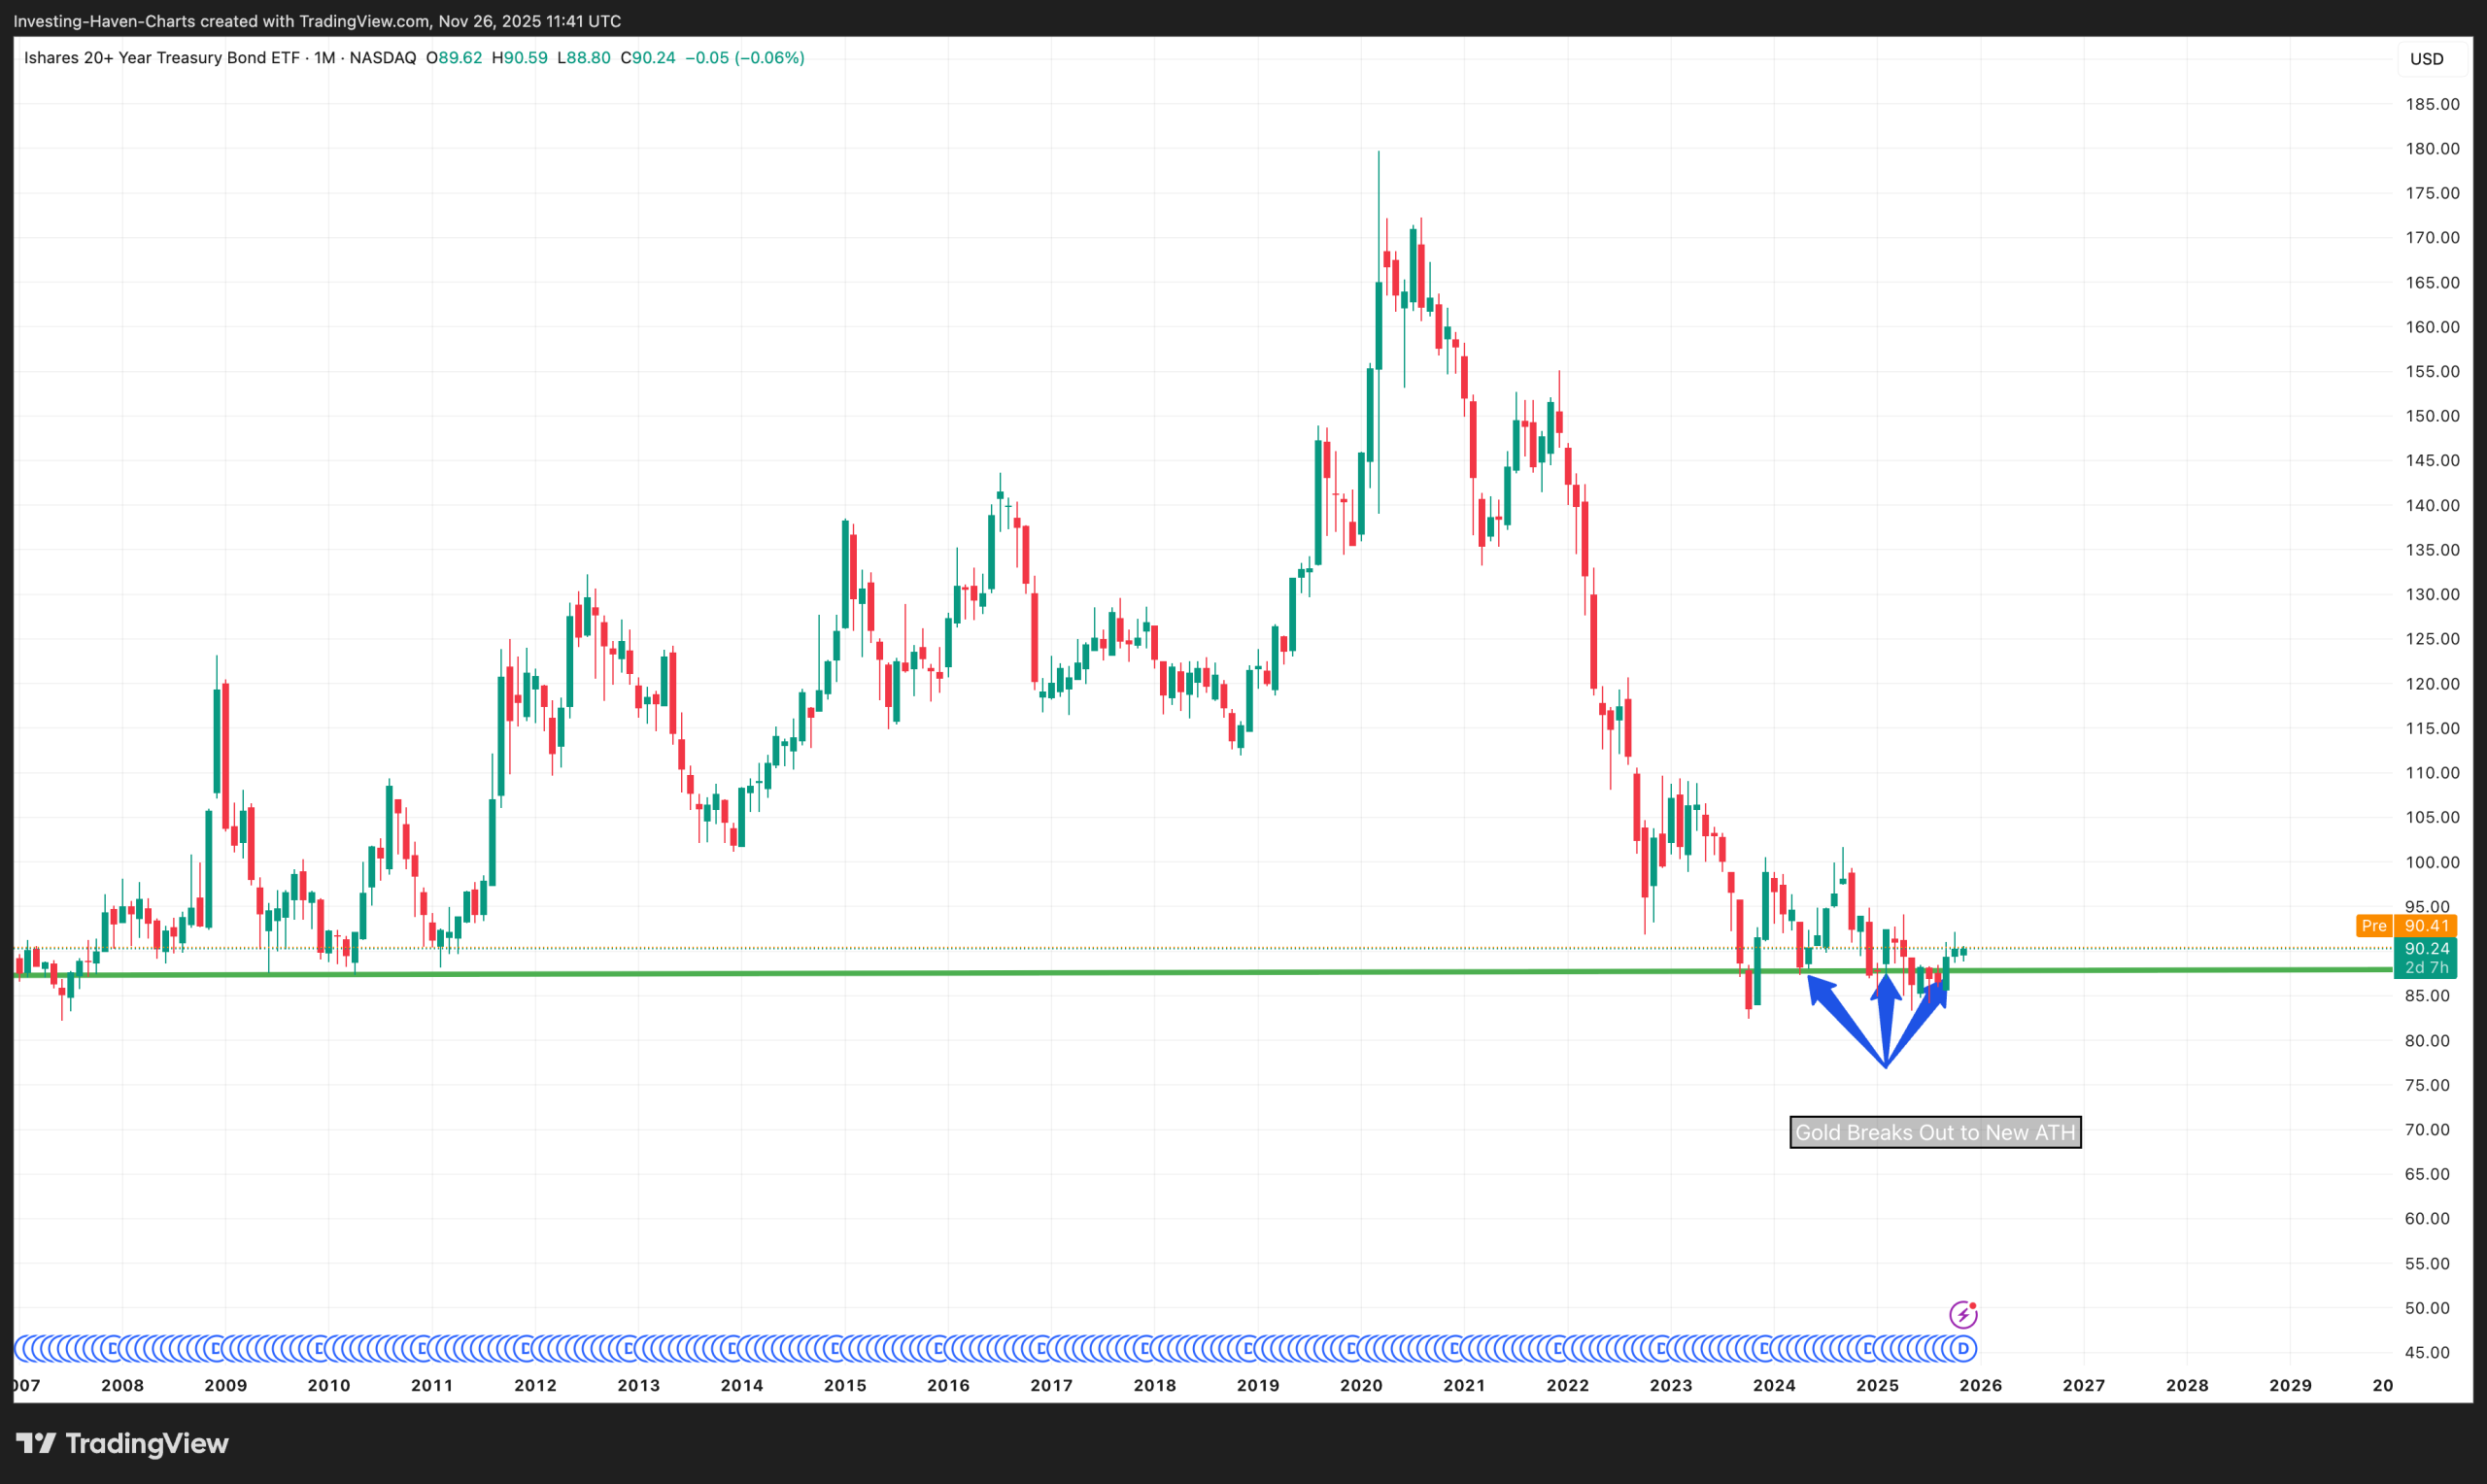
Bond prices and yields move in opposite directions.
When yields fall, long-term bond prices rise → TLT goes up.
When yields rise, long-term bond prices fall → TLT goes down.
November 2025 – The chart of TLT below is low because yields are climbing. If Yields stop rising in the 4.8% area, it should remain a gold friendly environment.
7. Gold price leading indicators: the futures market.
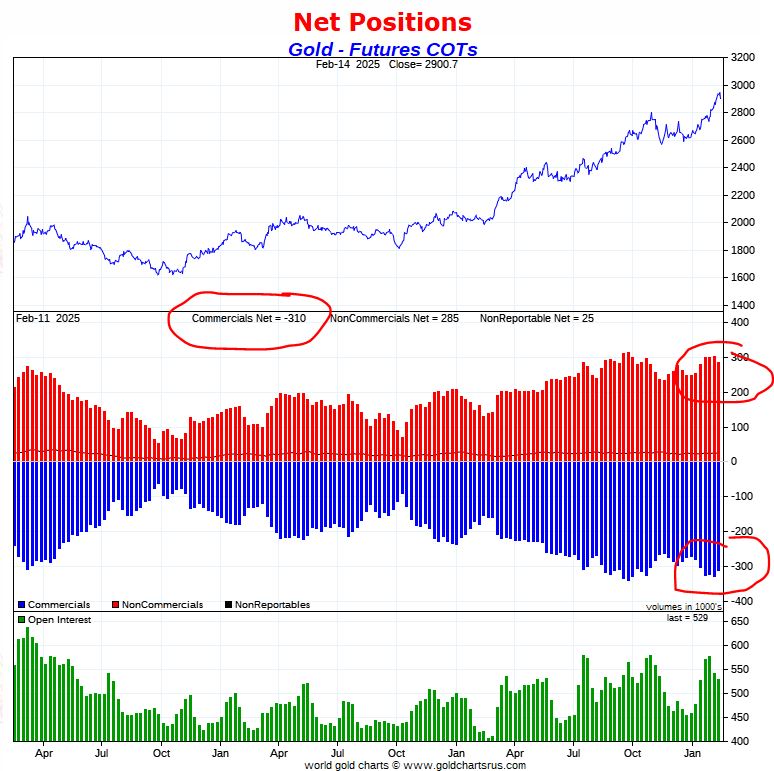
The 2nd leading indicator for gold is the futures market, particularly net short positions of commercials.
The way to read this next chart:
- The first pane shows the gold price over 9 years.
- The center pane features net long positions of non-commercials in blue. Red bars represent net short positions of commercials.
- We think of the net short positions of commercials as a ‘stretch indicator’. If those positions are very low, the price of gold cannot be ‘suppressed’ too much. Conversely, if those positions are ‘stretched’ (high), the price of gold has not a lot of upside and/or it cannot rise fast.
The current state of net short positions of commercials, when combined with the above mentioned leading indicators and fundamental driver (inflation expectations) suggest a soft uptrend in gold is possible. The net short positions of commercials remains elevated.
NOTE – The above mentioned leading indicator is one of the data points that is related to the gold price manipulation theory. Late Theodore Butler was able to articulate the relationship between the gold futures market and gold manipulation in a very detailed way.
8. Gold price predictions: an overview
The gold charts and gold’s leading indicators confirm that gold is set to rise in the coming years.
A soft gold bull market is our thesis – an acceleration to the upside will take place later this decade.
The overview of our gold price prediction analysis:
- Secular gold price charts – a gold bull market is the result of a 10-year bullish reversal completion.
- Gold prices in global currencies – the gold bull market started in all global currencies early 2024, before the gold price USD breakout in March/April of 2024.
- Monetary dynamics – M2 and CPI are steadily rising, this underpins a soft gold bull market.
- Fundamental gold price driver – inflation expectations are respecting a secular rising channel which supports the gold bull market thesis.
- Gold price leading indicators (EUR & Treasuries) – the EUR and Treasuries both look bullish on their secular timeframes; this creates a gold-friendly environment.
- Gold price leading indicator (COMEX) – the gold futures market positioning suggests stretched net short positions by commercials which limits the upside potential in the gold price, a soft uptrend is possible though.
All this leads us to believe that the price of gold will continue its steady rise.
Gold price prediction overview:
This is our forecasted gold price for the coming years. Prices reflect gold's spot price.| Year | Gold price prediction |
|---|---|
| 2025 | $2,410 to $3,265 |
| 2026 | $2,800 to $3,805 |
| 2027 | $3,400 to $4,400 |
| 2030 | Peak price: $5,155 |
NOTE – Our initial gold price prediction for 2025 was $3,255 – we published this target back in October 2024 – this predicted target was achieved.
NOTE – Bullish gold price predictions invalidate once gold falls and stays below < $1,770 (very low probability).
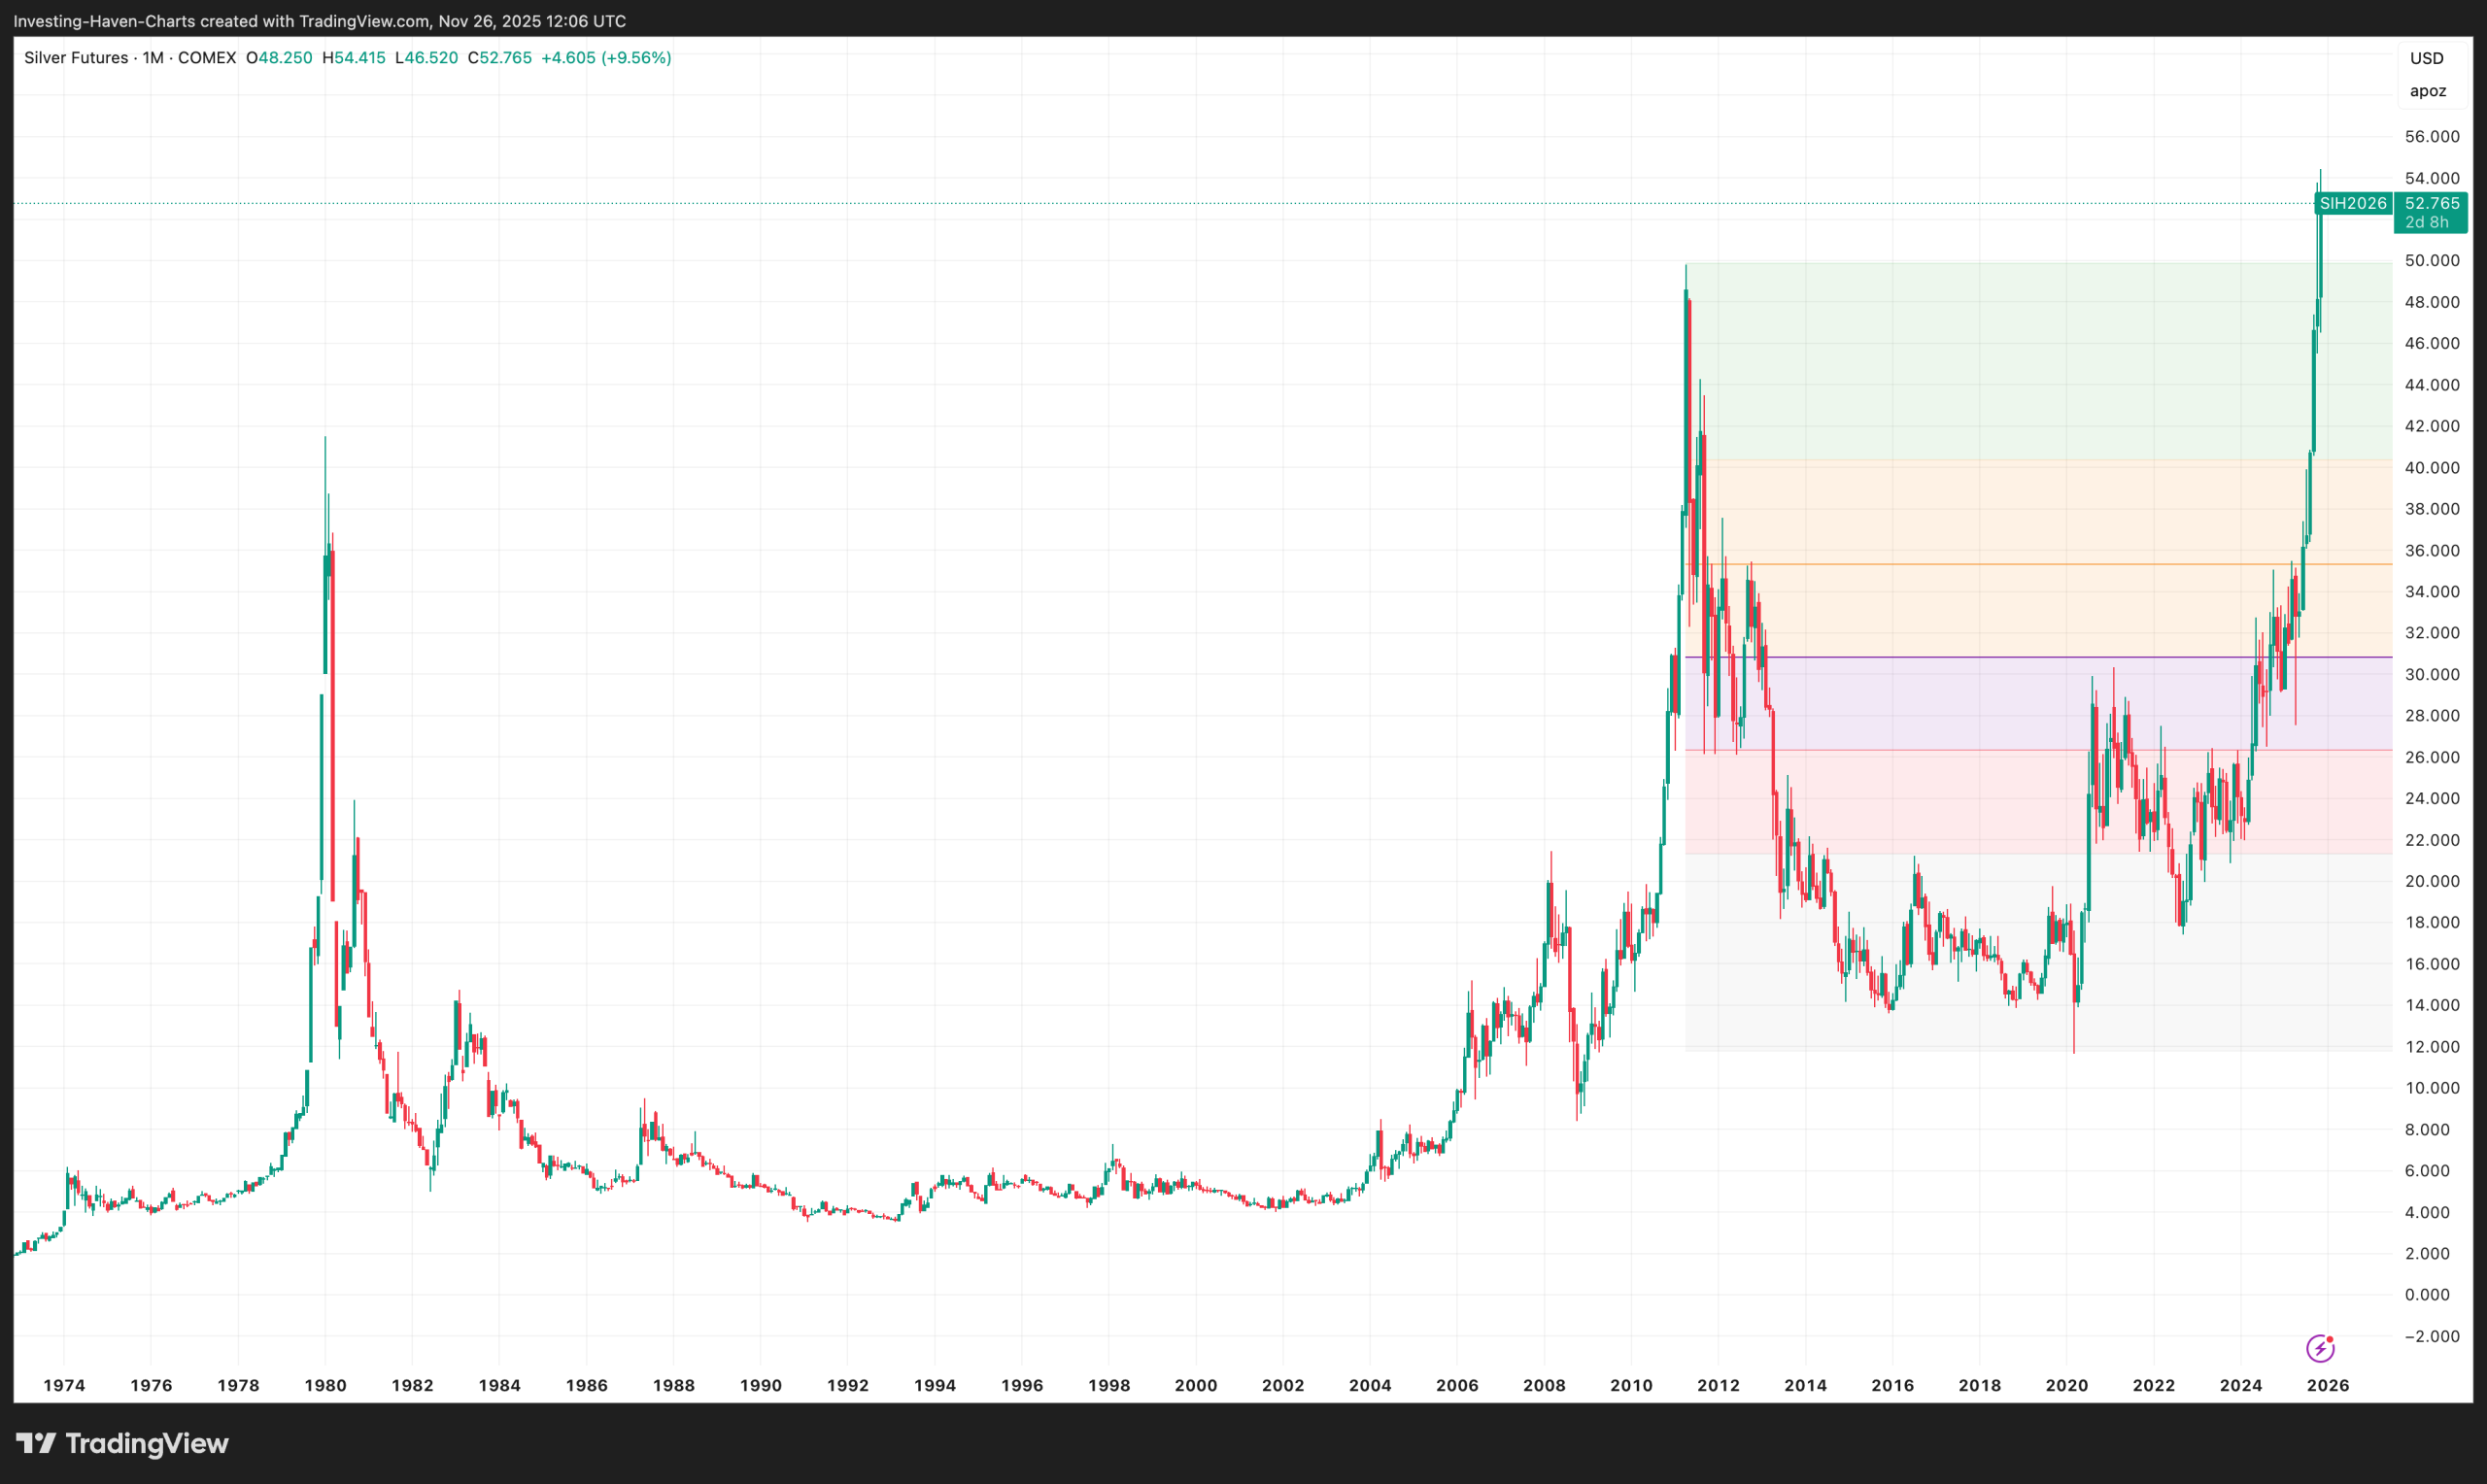
9. Gold or silver? Or both?
Should investors focus on gold or silver in 2025 and beyond? As explained in great detail in our silver price prediction, our answer is very clear: silver will be explosive sooner or later while gold will be steady! This next chart says it all, and makes our point.
10. Gold forecasts by institutions
In this section, we benchmark our own forecasts against those of prominent financial institutions.
Gold price predictions for 2025 from financial institutions
| Institution | Updated Gold Price Forecast for 2025 |
|---|---|
| Goldman Sachs | $3,700 (raised from $3,100) |
| J.P. Morgan | predicts $3,675 |
| Bank of America (BofA) | projects gold to hit $3,500 (previously $3,000) |
| UBS | anticipates gold reaching $3,500 (up from $2,800) in 2025 |
| Commerzbank | $2,750 (previously $2,600) in 2025 |
| ANZ | $3,600 (previously $2,805) by the end of 2025 |
| Macquarie | $3,500+ (expects a spike above $3,000) |
| Citi Research (Citigroup) | predicts $2,700 – $3,300 ( 2025 revised range) |
| ING Bank | predicts gold prices averaging $2,900 (previously $2,700) |
| Citibank | predicts a gold price of $3,300 (unchanged) |
| HSBC | forecasts gold prices from $2,600 – $3,215 (broader forecast range) |
| Commonwealth Bank | predicts average gold prices of $3,000 (average in Q4 2025) |
| Société Générale | $3,500 (previously $2,900) |
| World Gold Council | foresees a gold price of $3,000 (unchanged) |
| OCBC Bank | raises its gold price target $3,900 (up from $2,700) |
| Heraeus Precious Metals | expects a gold price of $2,950 (unchanged) |
A convergence of gold predictions
Gold price forecasts from large and respected financial institutions reveal a growing optimistic outlook for gold prices in 2025, with a noticeable convergence in the $3,000 to $3,700 range.
InvestingHaven’s bullish outlook
InvestingHaven’s prediction for gold in 2025 stands at approximately $3,500 – $3,800, reflecting a more bullish outlook than those of other institutions. This divergence highlights our belief in leading indicators of the gold price, including heightened inflation and increasing central bank demand. Additionally, the very bullish chart patterns in long-term gold charts tell a compelling story.
11. Gold predictions FAQ
Is gold bullish or bearish?
Gold is currently bullish. Our charting analysis suggests gold is currently in a bullish trend which is further fuelled by global uncertainty and global tariffs.
What will gold be worth in 5 years from now?
The peak gold price forecast for the coming years, heading into 2030, is in the range $4,500 to $6,200. A gold price of $5,150 is a reasonable target by or before 2030. This psychologically important level might be a peak price.
Can the price of gold ever rise to $10,000?
While a gold price of $10,000 is not unimaginable, it will require extreme market conditions for it to materialize. In case inflation gets out of hand, similar to the 70s, gold may rise to $10k. Alternatively, in case of extreme fear by geopolitical tensions, gold may hit $10k.
What will gold be worth in 10 years from now?
For this, we prefer to stick to the gold peak price prediction by 2030. That’s because market conditions tend to change every decade. It is impossible to forecast what might happen past 2030. The gold peak prediction by 2030 is $6,200 under regular market conditions.
What will the price of gold be in 2040 and 2050?
Frankly, it is an illusion to believe that anyone can predict the gold price more than ten years into the future. The reason: each decade presents its own unique macroeconomic dynamics, which change significantly every decade. This dominant market dynamic makes it impossible to forecast gold prices beyond 2030.
Weekly Gold Price Analysis
Our public blog posts typically share high level insights that are not actionable. For actionable insights, we recommend considering our detailed gold & silver price analysis. It is a premium service, covering leading indicators of the gold price and silver price. Premium service: Gold & silver price analysis >>
How to Invest in Gold with eToro
Looking to benefit from the current gold trend and your gold price forecast or prediction? With eToro you can get exposure to gold in just a few clicks.
- Open a free eToro account and complete verification.
- Search for “Gold” or related instruments on the platform.
- Decide your position size, set risk parameters, and place your trade.
Start Investing in Gold on eToro
Disclaimer: 61% of retail investor accounts lose money when trading CFDs with this provider. You should consider whether you can afford to take the high risk of losing your money.


