The cup and handle formation on the 50-year silver chart is immensely bullish.
Silver is the one asset that has the most powerful (bullish) long term chart structure. This bullish reversal pattern which is visible on the 50-year silver chart has a very obvious target: all-time highs (ATH).
Silver’s secular bullish reversal is exceptional and unique. It is visible, first and foremost, on the silver price chart of 50 years.
Admittedly, there is no other chart that has a long term reversal that looks as powerful as the one of silver price chart of 50 years. In fact, what stands out, is the exceptional duration of this formation. While we often see bullish reversals, also in the form of a cup-and-handle reversal, there is no other bullish reversal that has a reversal over 5 decades.
Remember, there is a saying that goes “the longer the base the higher in space” which really means that there is more bullish energy the longer the bullish consolidation (reversal).
Stated differently, silver, having the longest bullish chart reversal, qualifies as the asset with most upside potential this decade.
Let’s look at the 50-year silver price chart, and derive factual conclusions from our silver chart analysis.
Silver rallies every decade
Silver has a track record of staging a rally, at least once per decade. In fact, whenever silver stages a rally, it ‘pumps’ hard, really hard.
Since the major top which was set in 1980 silver was able to stage exceptional rallies in these years:
- 1982
- 1987
- 2004-2008
- 2010-2011
- 2020
What stands out it that most of these years coincided with secular bull market in stocks.
In other words, silver needs a stable stock market in order to stage its typical secular breakouts and double-digit to triple-digit rallies.
Interestingly, as we head into 2025, the stock market is showing signs of a stable move higher.
We are convinced that silver will exceed $50 before the end of 2026.
RELATED – When Will Silver Hit $50 an Ounce?
One of the many reasons we believe so is the typical, historical pattern we see when analyzing the gold to silver ratio. We discuss the gold to silver price ratio in one of the next sections. In all instances when the gold to silver ratio exceeded 100x, it came with an historical silver rally soon after.
Note – we stick to our bullish silver prediction: The price of silver will move to our first bullish target of $34.70 in 2024 (we wrote this in early 2024). We predict $48 in 2025.
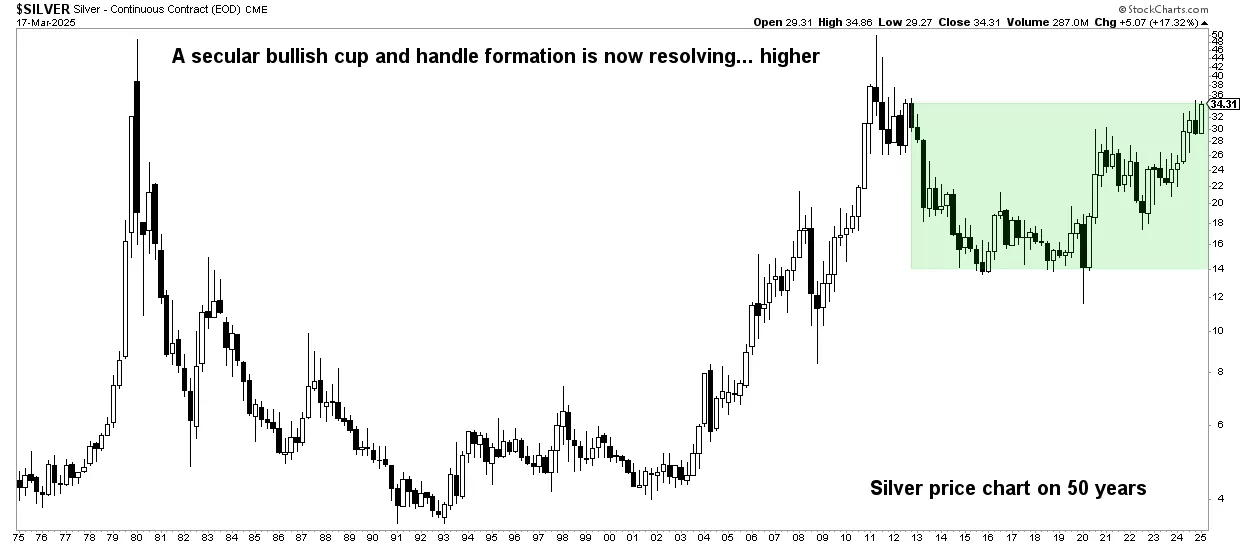
Silver 50-year price chart: A secular bullish reversal
Silver’s 50-year price chart has this unusually long (hence strong) cup-and-handle formation.
Silver price chart over 50 years
When carefully analyzing the chart structure, we see a few characteristics worth calling out:
- The peaks of 1979 as well 2011. They frame up the giant ‘cup’ formation.
- The flat range in the 80ies and 90ies.
- The non-stop decline since 2011 which only accelerated in 2013. This bottomed between 2016 and 2018 with a big double bottom.
- The breakout of 2019 shows suggests the ‘handle’ formation is underway now.
What does this cup-and-handle suggest? This is how we interpret this chart:
- Silver turned its 8-year downtrend (previous decade) into an uptrend (this decade).
- This uptrend is likely going to last for a comparable number of years, notably 8 years (approximately).
- Assuming 2019 marked the start of the new silver uptrend, we expect silver to exceed all-time highs in 2025-2026.
- It is fair to assume that $50 will be touched in 2025.
Early 2025, we observe relevant insights from silver’s 50-year price chart:
- Silver confirmed its 9-year reversal pattern, in 2020, and is now clearly in the ‘bullish side’ of the long term bullish reversal.
- The consolidation since summer of 2020, in the meantime, more than 3 years, is close to switch to a new uptrend.
- Based on other chart timeframes, the real breakout of spot silver is $25.
- We predicted silver to touch $34.70 in 2024 which it did.
We believe that silver will trade well above $37.70 in 2025 which will open the door for a quick move to $50. That’s our silver price prediction 2025.
Silver chart commentary for 2025
January 1st – The silver price chart over 50 years shows how a secular breakout of the cup and handle formation is in progress. The recent drop is a back test of the bullish breakout level. There is one full quarterly candle above the breakout point. This can be huge, provided silver closes above $28.8 an Ounce on March 31st and June 30th, 2025. The bullish (high probability) outcome we see on this 50-year silver chart: silver moves to $50.25 in 2025.
Needles to say: we need a spot silver chart to cover a 50-year time period, not the futures chart.
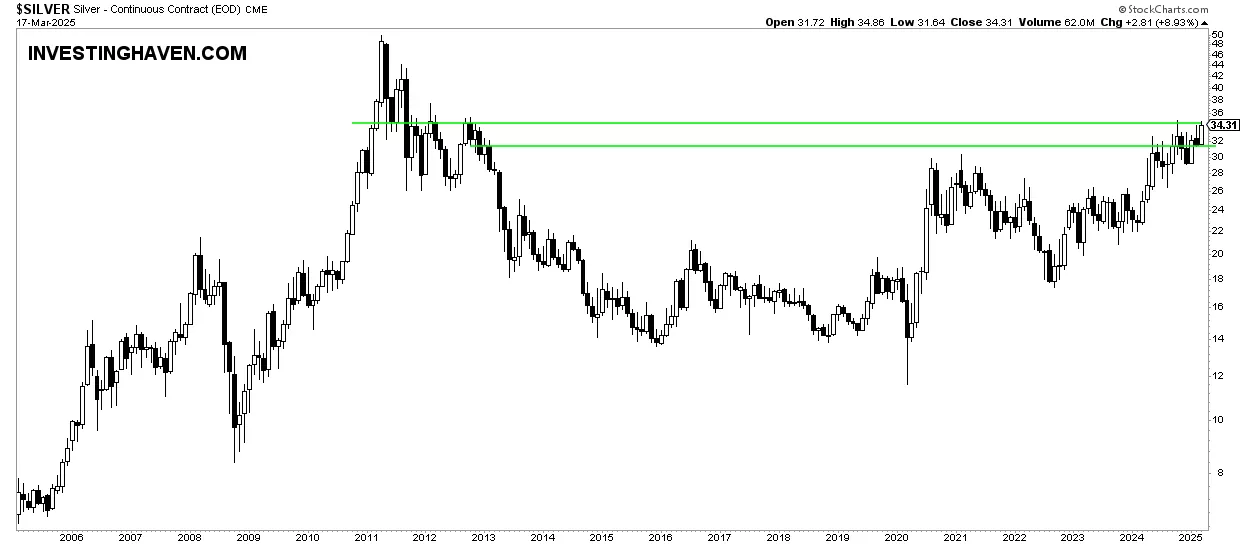
Silver price chart on 20 years
We feature two more silver charts, both over 20 years. Both of them have an insight which is complementary to the 50-year silver chart.
First, the 20-year silver chart with the most basic trendlines annotated shows that silver is very, very close to a breakout point. In fact, we derive $25 as the secular breakout point of this 20-year chart structure.
October 1st – The silver price chart on 20 years clearly points to a target area of $34.70 to $37.70 to be hit somewhere towards the end of 2024.
January 1st – The predicted target of $34.70 got hit. The ongoing pullback should respect $26.60 an Ounce. If it does so, we believe it will be unavoidable for silver to move to the $48-50 area in 2025.
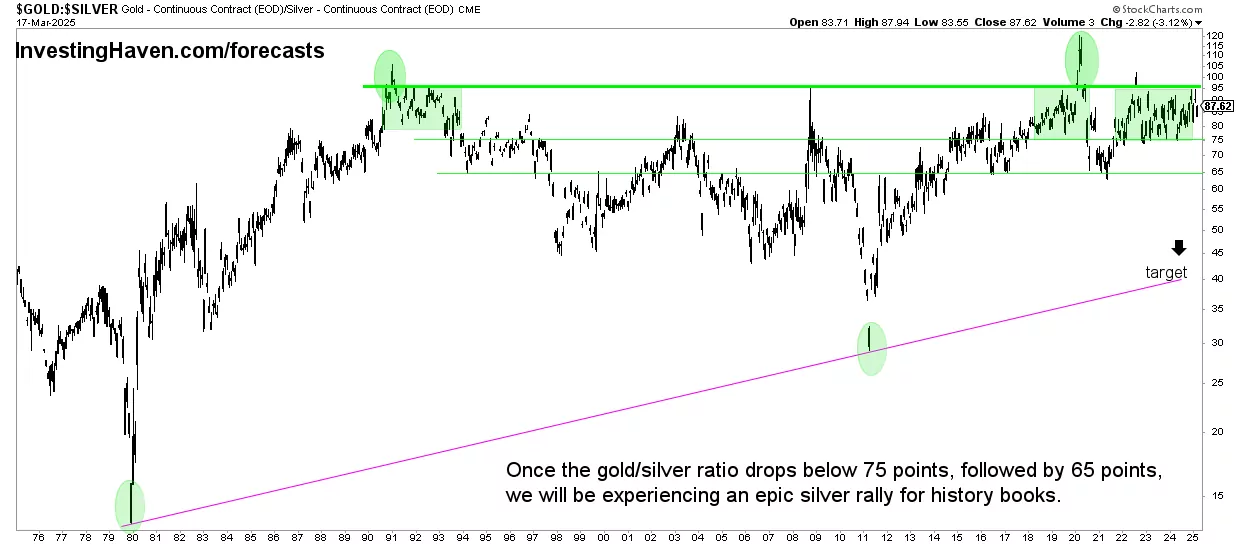
Gold to silver price ratio on 50 years
Below is the gold to silver price ratio over 50 years.
This ratio acts as a ‘stretch indicator.’ It helps us understand when the price of silver is undervalued vs. overvalued relative to the price of gold.
The horizontal green line is the important level: 92 points.
Any time, in history, when the gold/silver ratio achieved 92:1, it pushed the price of silver much higher. In some cases it took a few years, in other cases a few months, before silver became explosive.
January 1st – The gold to silver price ratio over 50 years is screaming SILVER IS UNDERVALUED. We truly believe is wildly undervalued, and this won’t last for long. As soon as the USD calms down, early 2025, silver will likely prepare to take off like a rocket.
Will the developing silver shortage push silver higher?
One question that comes up frequently is why the price of silver is not trading closer to its ATH.
In the end, all commodities went up to their 2007-2012 peak.
Moreover, with silver experiencing a supply deficit, it just makes so much sense to expect a big bull run in the silver market. Even Reuters mentioned that industrial demand, particularly in solar, will continue to rise.
To be honest, our viewpoint is that all conditions are in place for silver to run to its two higher targets:
- $34.70
- $50.
The question why silver is not trading at those levels is a good question to ask. The ‘silver manipulation’ theme comes up as an answer. Concurrently, the other answer that comes up is ‘opportunity’: if an asset is undervalued, it usually is a matter of time until a rebalancing act occurs.
Eventually, given all the data points outlined in this article, we believe that silver will move to those higher targets. Especially the immensely strong bullish reversal on the 50-year silver price chart makes us very confident about our silver forecast.
Silver – short term vs. long term
We totally agree with this X post:
$SILVER Buying levels are approaching. It’s one of the most difficult markets to trader. I am a long term investor #SILVER #GOLD
Silver should not be traded on the short term.
Silver requires a long term approach, hence our focus on analyzing the 50-year silver price chart and similarly long timeframes.
Looking at silver on the short term is too complicated for most, if not all, market participants.
Long term oriented silver investing analysis
We offer detailed gold & silver price analysis, as a premium service, covering every week leading indicators of the gold price and silver price. Premium service: Gold & silver price analysis >>


