A take-away from the 50-year gold chart: a long term bullish chart pattern completed in 2024. There are several more take-aways from gold’s long term price chart.
We live in a time of chart overload. The number of gold charts that appear on all sorts of online outlets is creating noise for investors in gold.
- Gold investors should focus on a few charts, the gold charts that matter.
- In a top-down approach, the longest timeframe that matters most is the gold price chart of 50 years.
The gold price chart over 50 years is the one on which dominant gold trends become visible.
We look at the gold price in this article, particularly 4 different variations of the same 50-year gold price chart.
Gold price chart of 50 years
First, the 50-year gold price chart limited to no annotations.
We look for the most obvious take-aways from the chart with a ‘keep things simple’ mindset.
READ – Gold price prediction 2025
Essentially, the 50-year gold chart has 4 distinct phases, arguably the 5th one just got started in 2024:
- A very steep rise in the 70s.
- A quick pullback in 1980 which initiated a long consolidation that lasted 20 years.
- A slower rise that took some 10 years.
- A quick pullback in 2013 which initiated a consolidation that lasted 10 years.
Arguably, a new uptrend started in 2024.
Take-away #1 from the 50-year gold price chart: over the long term, the uptrends become softer, the consolidations become softer.
Phases on the gold price chart of 50 years
We go deeper into each long term phase on gold’s 50-year chart. We play back gold’s history by simply reading its chart patterns.
1970-1980: an epic rally
The gold price was in a very steep uptrend.
It reminds us of Bitcoin, in a way, in terms of the chart structure.
Inflationary pressures were the catalyst.
The Fed ended the parabolic rise of the gold price in 1980 by raising rates to 17%.
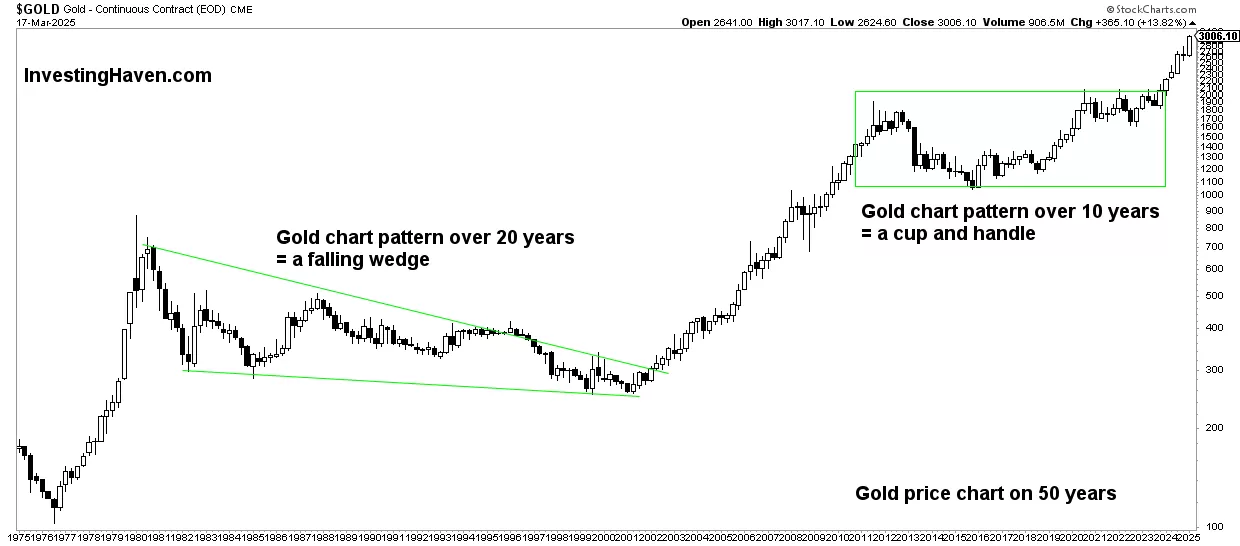
1980-2001: an epic consolidation that morphed into a bullish falling wedge
The bear market took 20 years to complete.
Carefully looking at the structure of the bear market, it reveals a falling wedge. This is a bullish pattern.
The longer a pattern takes to complete, the more powerful its subsequent trend. As the falling wedge is bullish, the subsequent bull market was very powerful – gold start an unusually long bull market of 10 years.
2001-2011: an epic bull market of 10 years
A bull market of 10 years is unusual, certainly for a commodity.
Gold started rising after the stock market crash introduced by the dot com crash.
Gold peaked in early September 2011, right below $2,000 an Ounce.
2013-2023: a consolidation that morphed into a cup and handle chart formation
Interestingly, the second secular bear market of gold took 10 years to complete:
- The bull market that preceded it took 10 years (2001-2011).
- This bear market is half as long as the previous one (1980-2001).
Whether there is some secular dynamic at play or not is unclear.
What matters is this: the consolidation turned out to be a bullish cup and handle formation. The length of this consolidation is long enough to ensure enough bullish power for the subsequent bull market.
A new gold bull market
As of March 4th, 2024, a new gold bull market was confirmed. It is clearly visible on the gold price chart of 50 years.
As seen on the 50-year gold chart, the 10-year consolidation completed on that date: March 4th, 2024.
On that date, gold entered a new bull market specifically after it cleared its former ATH.
2024 marks the start of gold’s third secular bull market.
Dynamics on the 50-year gold chart
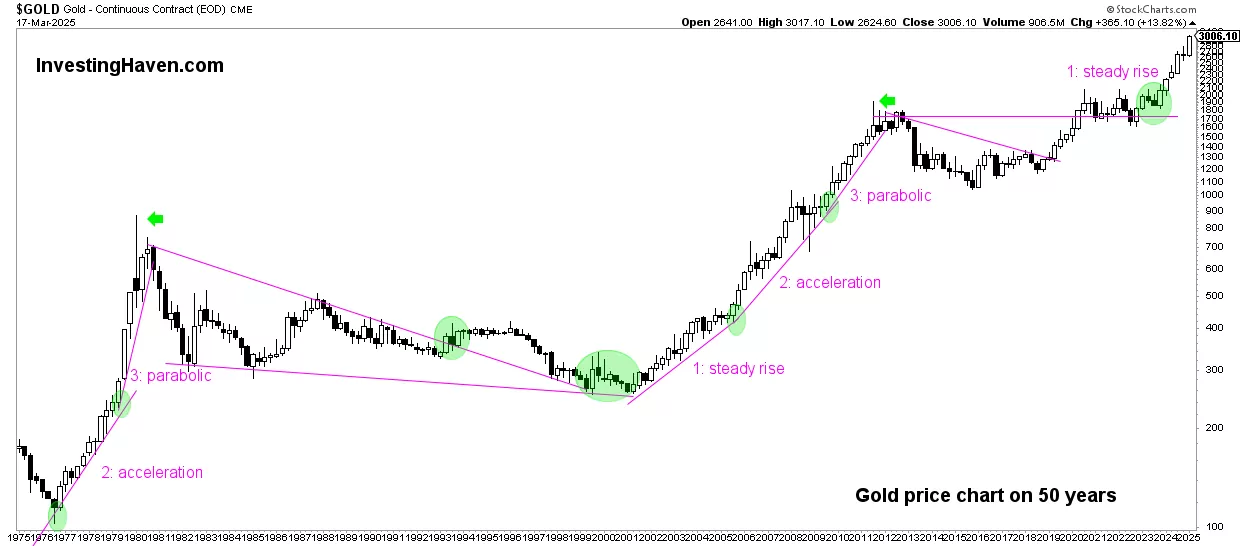
Gold’s bull markets tend to rise in 3 phases. Each phase is less aggressive when it rises, sort of slower and not as steep in its slope. The gold rally in the 70s was very steep, exponential as opposed to the one that started in 2001.
The consolidations tend to have similarly bullish chart formations however different structures:
- A falling wedge, bullish.
- A cup and handle, bullish.
Because of the bullish nature of both patterns, the subsequent bull market tends to unfold in 3 phases:
- A steady rise.
- An acceleration higher.
- The parabolic part which completes after setting a blow off top.
The strong rallies occur a minority of the time, particularly in phase 3 of an uptrend. That’s when most money is made.
The gold market’s behavior over these phases highlights specific dynamics:
- Gold bull markets typically unfold in three phases: a steady rise, an acceleration, and a parabolic phase culminating in a blow-off top.
- The current state of the gold market indicates it is in the steady rise phase, consistent with previous bull markets.
The current state of the gold market suggests a steady rise, consistent with the previous bull markets.
We are confident there is much more room to the upside for the gold price.
The gold price chart over 50 years: the flipside
Any bullish case should be set next to a bearish case.
The gold chart helps us understand ‘what if’ there would be a bearish case. Or, stated differently, ‘what could go wrong’ with gold.
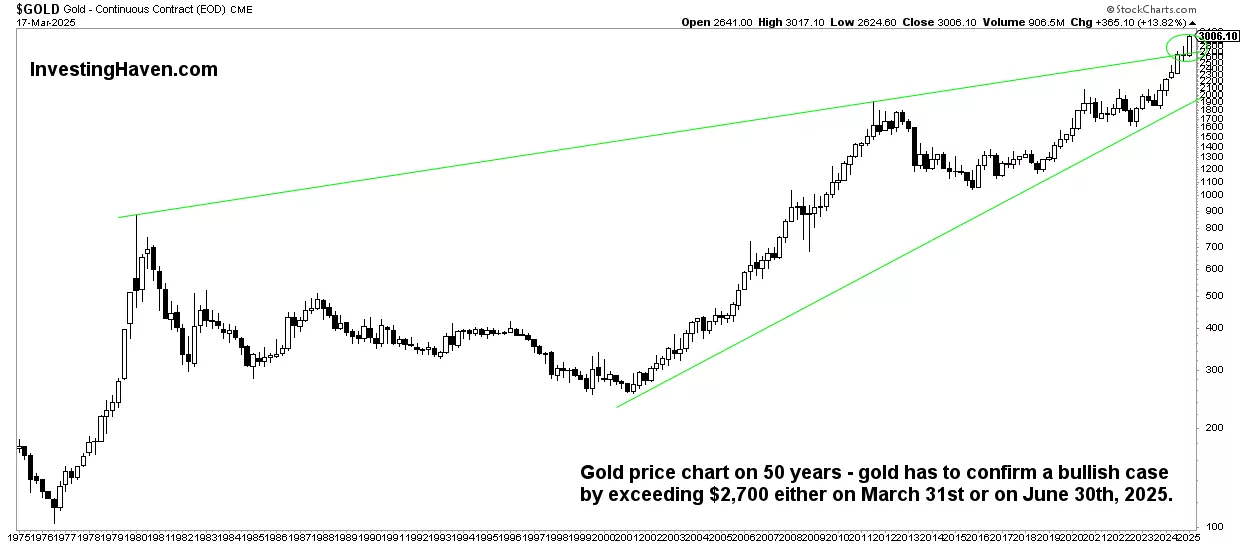
The next version of the 50-year gold price chart paints a different picture (potentially bearish) compared to the one shown above (bullish).
Below chart features a rising wedge which is by definition a bearish setup. When will this setup become concerning:
- Gold’s current or next quarterly candlestick leaves a large wick similar to the ones in 1980 and 2011. This would come with a big drop before Dec 31st, 2024, or March 31st, 2025. We are not predicted this, we are only defining the conditions to understand bullish vs. bearish outcome.
Now, if there is one very strong and compelling reason why gold may will move higher it would be the fact that gold’s breakout in April of 2024 resulted in just a 30% rise. Compare this to 1980 and 2011 when gold went up triple digits before hitting a strong turning point.
In any case, gold needs to clear $2,800 in the coming quarters for it to remain in its bullish market, it should also not breach $2,000 (former ATH now support).
March 18th – This rising wedge is invalidated. It’s the ultimate proof that gold is in a bull market. No bearish pattern visible on any gold chart on any timeframe.
Gold’s future looks good for long term investors
Given the historical trends and current chart patterns, the long-term outlook for gold remains bullish.
Investors can expect a continued rise, although at a potentially slower and steadier pace compared to the past. The bullish chart formations observed, such as the falling wedge and cup and handle, suggest strong potential for significant gains in the coming years.
By understanding these long-term trends, serious investors can make informed decisions and capitalize on the opportunities presented by the gold market.
Weekly Gold Price Analysis
We offer detailed gold & silver price analysis, as a premium service. In it, we cover leading indicators of the gold price and silver price, every weekend. Our premium Gold & Silver market report >>