DOT prediction insights
Featured prediction **July 1st**
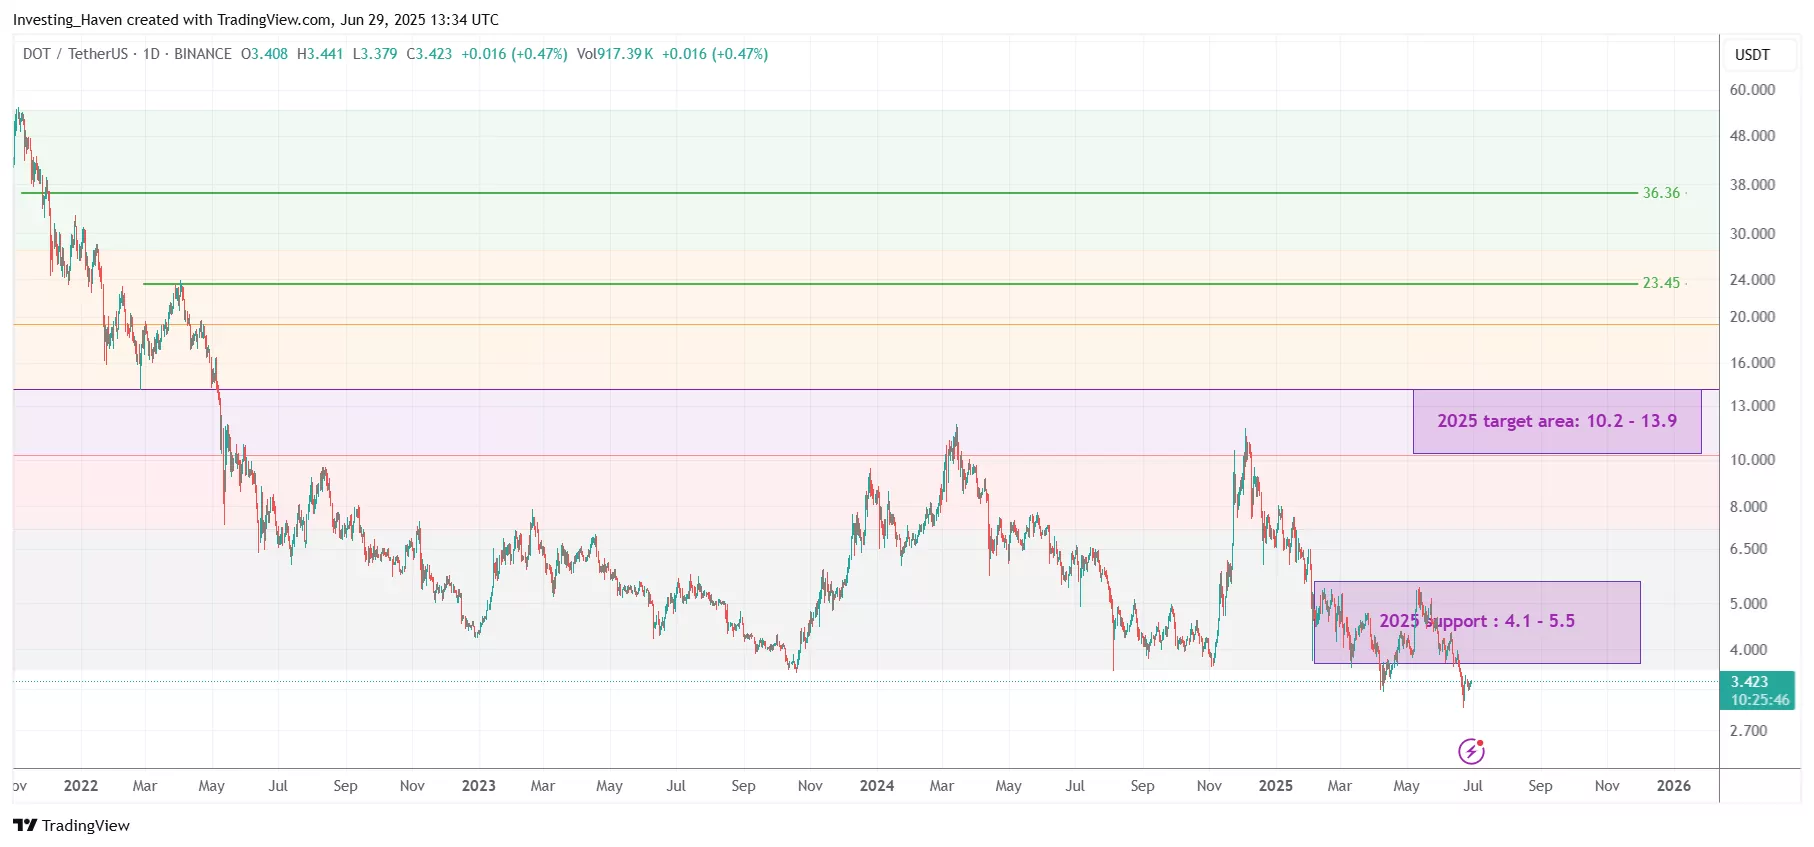
- [ALERT] – Polkadot broke below its multi-year support line. How concerning is this?
DOT price prediction 2025:
- In 2025, Polkadot (DOT) is forecasted to see prices ranging from a low of $4.01 to a high of $13.90. The critical 50% Fibonacci level at $14.04 will play a pivotal role in shaping bullish trends. On the flipside, DOT must respect its multi-year lows at $3.69 on a 3 to 5 week closing basis to avoid a breakdown.
DOT time forecast:
- Polkadot’s predicted consolidation time window was March 14th – April 13th (accurate), our predicted bullish trend would start on May 10th (accurate). However, the rally was short-lived and not intense. The next bullish window should start somewhere mid-July to mid-August (TBC).
Table of contents
Polkadot price prediction overview
| Year | DOT price prediction |
|---|---|
| 2025 | $4.01 to $13.90 |
| 2026 | $10.22 to $27.20 |
| 2027 | $39.51 |
| 2028 | $44.55 |
| 2029 | $50.9 |
| 2030 | Peak price $50.9 |
Polkadot chart pattern prediction: a giant bullish W-reversal which has to resolve higher for DOT predictions to be validated. Invalidation: DOT falls + stays < $2.20.
Polkadot price prediction 2025
Polkadot (DOT) price prediction 2025:
In 2025, Polkadot (DOT) is projected to range between $4.01 and $13.90, with the key 50% Fibonacci retracement level at $14.04 serving as a critical indicator for major upward movement. Polkadot must continue to trade above its critical support at $3.69 (it shouldn’t stay more than 5 to 8 weeks below this level).
July 1st – The most critical support level of $3.69 on Polkadot’s chart is at risk. This level must be reclaimed in a period of 5 to 8 weeks to avoid a breakdown. For now, DOT is vulnerable until and unless it reclaims $4.01.
Polkadot price predictions for 2025:
| Year | Price move | DOT price forecast |
|---|---|---|
| 2025 | Lows to highs | $4.01 to $13.90 |
| 2025 | Stretched | $19 |
| 2025 | Buy the dip | $4.14 to $4.44 |
| 2025 | Invalidation | < $2.20 |
GO PREMIUM – Receive crypto market analysis and token tips >>
Polkadot price prediction 2026
Polkadot (DOT) price prediction 2026:
In 2026, Polkadot (DOT) could potentially reach up to $36.25, provided it successfully breaks above the 50% Fibonacci level at $14.04. This key breakthrough would indicate strong bullish momentum, setting the stage for significant upward price movements. Maintaining support above $3.55 will be essential for sustaining this trend.
Polkadot price prediction 2027
Polkadot (DOT) price prediction 2027:
In 2027, Polkadot (DOT) is forecasted to move to the highest area of this decade. While it’s tough to predict three years out, it’s fair to assume that institutional adoption may push DOT towards the $39 area Pre-requisite: DOT clears $14.11 in 2025 or 2026, and respects $3.66 in 2025.
Polkadot price prediction 2030
Polkadot (DOT) price prediction 2030:
By 2030, Polkadot (DOT) is anticipated to reach a price of $36.36, reflecting substantial growth as it continues to expand and evolve within the blockchain ecosystem. This projection is based on DOT’s ongoing development, increasing adoption, and its role in enabling interoperable blockchain networks.
CHECK – Our recent multi-bagger successes from 3x to 30x >>
Polkadot timeline predictions
While most analysts focus only on price predictions, our focus is also on timeline predictions. Specifically for Polkadot (DOT), these 3 very important points on its timeline will have a decisive impact on price:
- Mid-September till October 28th, 2024; test passed successfully.
- February 2025.
- May 2025.
COMING SOON – Can Polkadot ever hit $1,000?
Polkadot peak price prediction
Polkadot (DOT) has a peak price prediction of $50.90, projected to be reached potentially before 2040. This forecast reflects the expected long-term growth and development of DOT’s network, as it becomes increasingly integral to fostering interoperability and scalability within the blockchain ecosystem.
| Polkadot peak price prediction | Probability in tme |
|---|---|
| Can DOT hit $50 | Likely before 2030 |
| Can DOT hit $100 | Likely before 2035 |
| Can DOT hit $500 | Potentially around 2040 |
| Can DOT hit $1,000 | Potentially around 2045 |
Polkadot price drop prediction
Polkadot (DOT) buy the dip level:
In the short to medium term, Polkadot (DOT) could see price drops to as low as $3.55. This level represents a critical support zone, where buying opportunities might emerge. Holding above this level is essential to prevent further declines and maintain a stable market outlook for DOT.
Polkadot prediction tomorrow
Today, Polkadot trades at $3.35. Tomorrow, on July 6, 2025, DOT is forecasted to move to $0, a change of 0.00%.
Polkadot prediction day-by-day
Over the next 30 days, Polkadot (DOT) is expected to see the following prices:
We are renewing the predictive model with an AI capability – day by day predictions will be back soon.
Polkadot price history
2020: Launch and early adoption
Polkadot launched its mainnet in May 2020, with its price quickly stabilizing around $2.70. The platform introduced a unique multi-chain architecture designed to promote interoperability and scalability across different blockchains. By the end of the year, DOT was trading around $9.30, reflecting strong market acceptance.
2021: Expansion and market surge
In 2021, Polkadot’s ecosystem saw rapid expansion, with significant interest in its parachain auction process, which further enhanced its infrastructure capabilities. The price of DOT peaked at approximately $49.35 in May, driven by the crypto market’s overall bullish trend and enthusiasm for its innovative technology. The year closed with DOT at around $28.60.
2022: Market adjustments and resilience
Following the broader market downturn, DOT’s price faced downward pressure, reaching lows around $6.00. Despite these challenges, Polkadot continued to develop its ecosystem, focusing on enhancing cross-chain functionalities and securing new partnerships, which helped maintain investor interest and stabilize the price towards the end of the year.
2023: Recovery and network strengthening
By 2023, DOT showed signs of recovery, with prices oscillating between $6.50 and $12.00. Polkadot concentrated on strengthening its network security and efficiency, leading to improved platform stability and increased adoption. The year is projected to end with DOT trading in the range of $10.50, signaling cautious optimism.
Polkadot predictions FAQ
Does Polkadot (DOT) have a future?
Polkadot has a promising future, supported by its innovative multi-chain architecture which supports interoperability and scalability. Its strategic development position it well for long-term growth and a significant role in the evolution of blockchain technology. DOT will experience long term success once above $14.04.
Is Polkadot (DOT) bullish or bearish?
Polkadot (DOT) is not bullish nor bearish at this point in time. While there is tremendous bullish potential, it did not manifest lately. In order for DOT to run bullish, it requires a strong bounce in 2025, confirming secular support and the potential in its long term W-reversal.
What will Polkadot (DOT) be worth in 3 years from now?
In three years, Polkadot (DOT) is projected to continue its growth, potentially aiming for a bullish target of $23.45. Should DOT rise above $14.04, it will confirm a bullish W-reversal, setting the stage for even higher targets due to its ongoing network developments and increased ecosystem adoption.
Can Polkadot (DOT) hit $100 by 2030?
Hitting $100 by 2030 for Polkadot would require significant advancements in its technology and broad adoption across blockchain ecosystems. This target could be achievable if DOT continues to enhance its interoperability features, and gain a top position in DeFi. Achieving such a milestone would depend on widespread institutional Polkadot adoption.
Disclaimer: The information presented in this article is for informational purposes only and does not constitute financial or investment advice. All opinions are those of the author and should not be interpreted as specific trading or investment recommendations. We do not guarantee the completeness, accuracy, or reliability of this content. Cryptocurrency markets are highly volatile and can experience unpredictable fluctuations. Readers are encouraged to conduct their own research, consider multiple perspectives, and understand local regulations before making any investment decisions.
