As 2025 kicks off, sugar has the potential to confirm a wildly bullish reversal. If so, our bullish silver forecast 2025 will be confirmed with a rise from $18 cents to $36 cents per pound in the coming 12 to 18 months.
Readers should note that forecasting the future direction of sugar is a real challenge. There are multiple factors that determine the price of sugar, one of which being supply/demand. Moreover, sugar is subject to the volatility which is typical for commodities markets.
- 1. Sugar price between 2014 & 2023, with a 2024 status
- 2. Global Sugar Market: Supply Demand Forecast
- 3. Supply Demand Factors In The Global Sugar Market
- 4. Sugar Market: Supply Forecast 2025 and beyond
- 5. Inflation as a Catalyst For Sugar Prices In 2024 & 2025
- 6. Unpredictability of the Sugar Market, How It Affects Sugar Predictions
- 7. Price Trends on the Sugar Price Charts
- 8. Sugar Price Target For 2025
- 9. Sugar Price Forecast for 2025
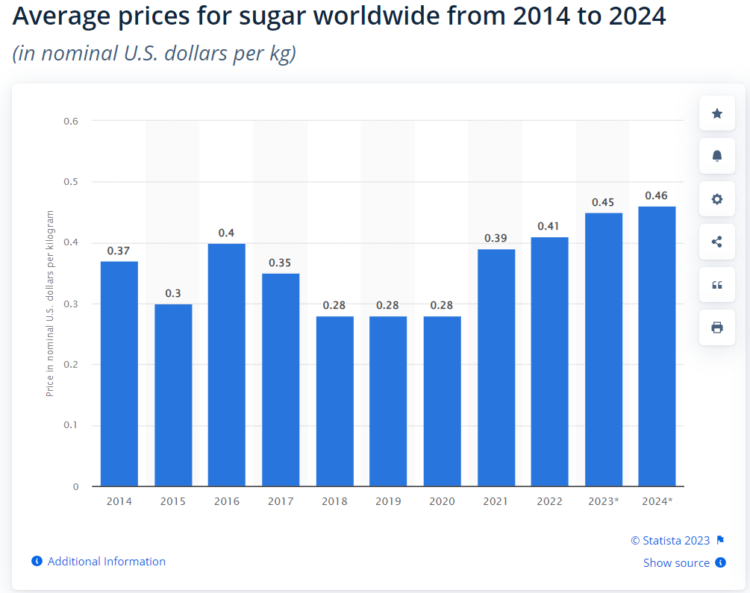
Sugar price between 2014 & 2023, and a 2024 status
This table depicts the sugar price, in U.S. dollar per kg, between 2014 and 2023. It also adds a sugar price forecast for 2024 which is very similar to the sugar price 2023. Source: Statista.
As seen, average prices were slightly declining between 2016 and 2020. Since 2021, sugar prices are on the rise again, although the sugar price rise is rather soft. Still, the forecasted sugar price for 2024 is slightly above the price of 2023. This creates a favorable dynamic for sugar investments.
Global sugar market: Supply demand forecast
We wrote our first sugar price forecast in 2019. Back then, supply and demand factors in the sugar market were not favorable. Below is an extract of what we wrote in our 2019 forecast.
As per this article on sugar supply/demand factors “sugar’s supply surplus will eventually push prices so low that production takes a hit. Sugar prices may see a rise to around 15 cents sometime in 2020 as the cost of production for efficient producers such as Brazil and Thailand stands at roughly 12 cents to 14 cents a pound. Prices will, of course, go up as producers go bankrupt, but that is a very slow process.”
The point that stands out from our 2019 forecast: “a global supply surplus.”
That’s also how it went, since then, as evidenced by the dip in sugar prices between 2018 and 2020.
Given the highly accurate correlation between supply/demand factors and the price of sugar, the question then comes up what supply/demand looks like going in 2024. The sugar supply/demand dynamics can help us understand what the expected future sugar price trend could be, directionally.
This next graph comes from czapp, it suggests that sugar production in 2024 will stay on par with 2023 production levels. The dotted line on the next graph represents expected consumption which continues to slightly rise in 2023 and 2024.
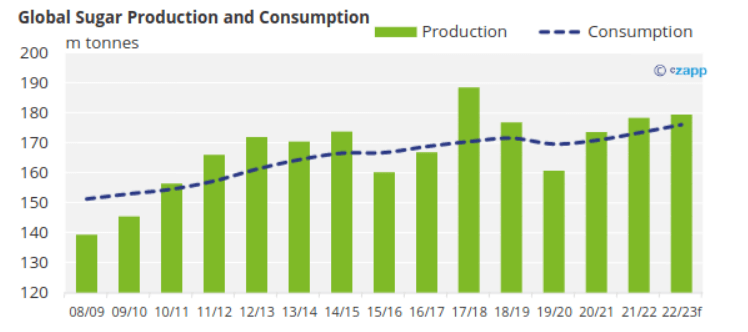
We can reasonably expect that supply/demand dynamics, even though difficult to forecast for the sugar market in 2024 and 2025, will avoid a bigger price drop. On the contrary, it is safe to conclude that, directionally, the sugar price in 2024 and 2025 will be higher.
Supply demand factors in the global sugar market
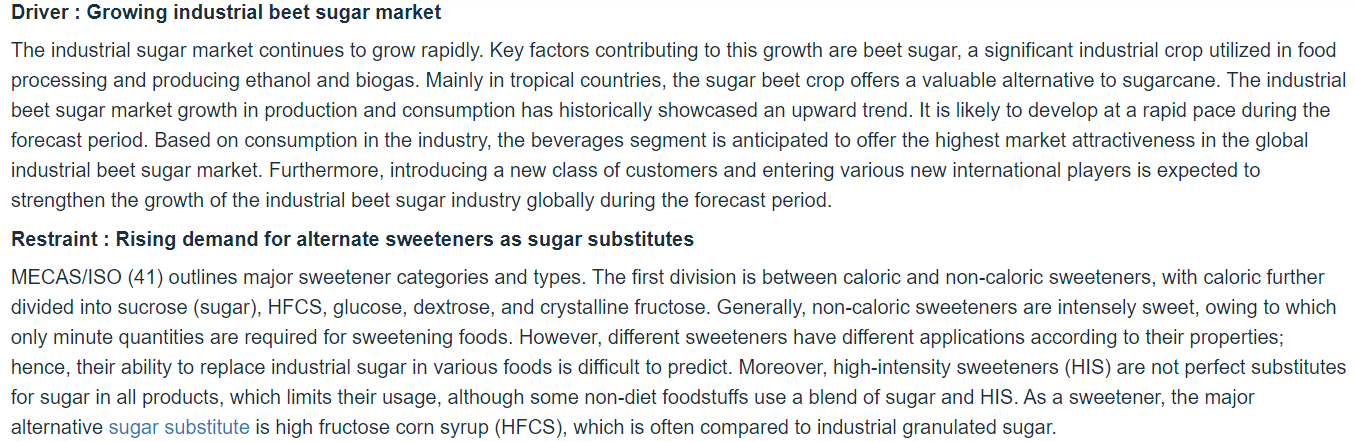
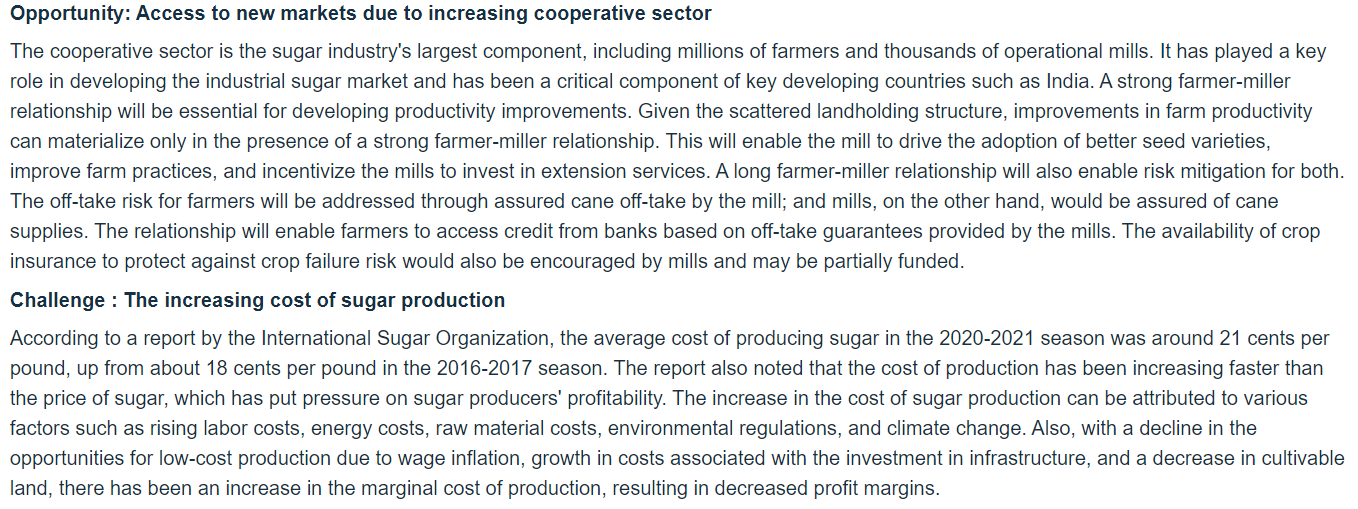
Courtesy of Markets & Markets, we can factor in the following global sugar market dynamics for 2024 and 2025. Below are the key highlights from the global sugar market:
- Driver: growing industrial beet sugar market. This is a growth driver specifically for the beet sugar market.
- Restraint: rising demand for alternatives, particularly sweeteners, competing with natural sugar.
- Opportunity: access to new markets due to increasing cooperative sector. The cooperative sector is the sugar industry’s larges component of key developing countries. As explained by Markets & Markets, this is a driver to professionalize the sugar industry in key producer markets.
- Challenge: increasing cost of sugar production. This is a factor that will put pressure on profitability of producers. However, they may decide to only offer their end product at a higher price to the market, which is a logic consequence from producer price inflation, resulting in a higher consumer price.
Below are the points provided from the sugar market analysis provided by Markets & Markets:
Sugar market: Supply forecast 2025 and beyond
The global sugar market is forecasted to grow at CAGR of 5%. Given the reliable correlation between supply and the price of sugar, we believe that all supply & demand data points in the sugar market confirm that the sugar price in 2024 & 2025 will move higher.
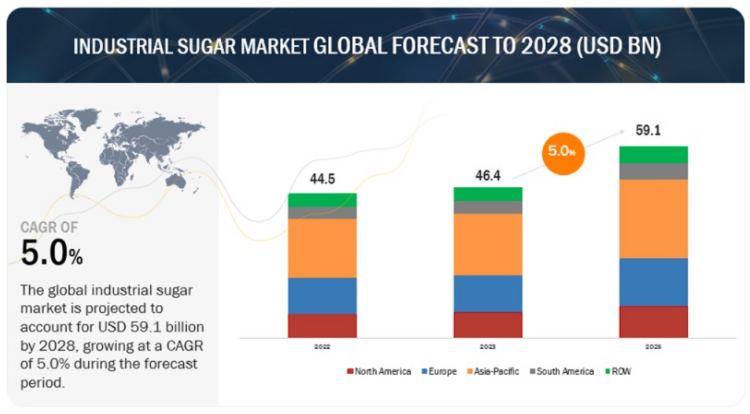
As explained on below infographic, the global industrial sugar market is projected to account for USD 59.1 billion by 2028, growing at a CAGR of 5.0% during the period 2023 to 2028. That’s a lot, it certainly justifies a directionally bullish evolution in the price of sugar.
Inflation as a catalyst for sugar prices in 2024 & 2025
Interestingly, the price of sugar has provided a really strong leverage during inflationary periods in the last 2 decades.
If we take 2016 as an example there was a giant rally in the price of sugar. However, this came after a major bottom in inflation expectations which largely may explain the strong rise in the price of sugar. Moreover, there also was a supply deficit more than a supply surplus back then.
The years 2010 and 2011 were somehow similar in nature when it comes to inflation expectations.
Our most important inflation/deflation indicator does not seem to indicate rising inflation, especially as long as The Single Most Important Chart Of 2023 respects its long term channel.
So, based on our flat inflation indicator we believe commodity prices will remain largely suppressed. Sugar cannot expect a bullish boost from the commodity sector.
Unpredictability of the sugar market, how it affects sugar price predictions
According to Jack Roney, director of economics and policy analysis for the A.S.A., the global sugar market is the most distorted commodity market in the world because of subsidies. “Today’s low prices are a result of these subsidies, and any bullish signals can be quickly undone by government intervention.”
Mr. Roney said the extreme volatility of the world market is the reason the United States has a sugar policy, and he urged governments around the world to put an end to competing subsidies.
“U.S. farmers are highly efficient, and we want to operate in a free market, but that cannot happen until all countries set aside their subsidies and let a real market form,” he concluded.
This obviously is a hugely important factor to take into account in the context of our sugar price prediction. Supply demand factors in the global sugar market are certainly a leading indicator for the price of sugar. But an unpredictable sugar market that can change fast, where weather can turn the market upside down, or a country suddenly can influence market dynamics makes a reliable prediction challenging.
In other words, we need to build in guardrails into our sugar price forecast for 2024 & 2025.
Price trend(s) on the sugar price chart
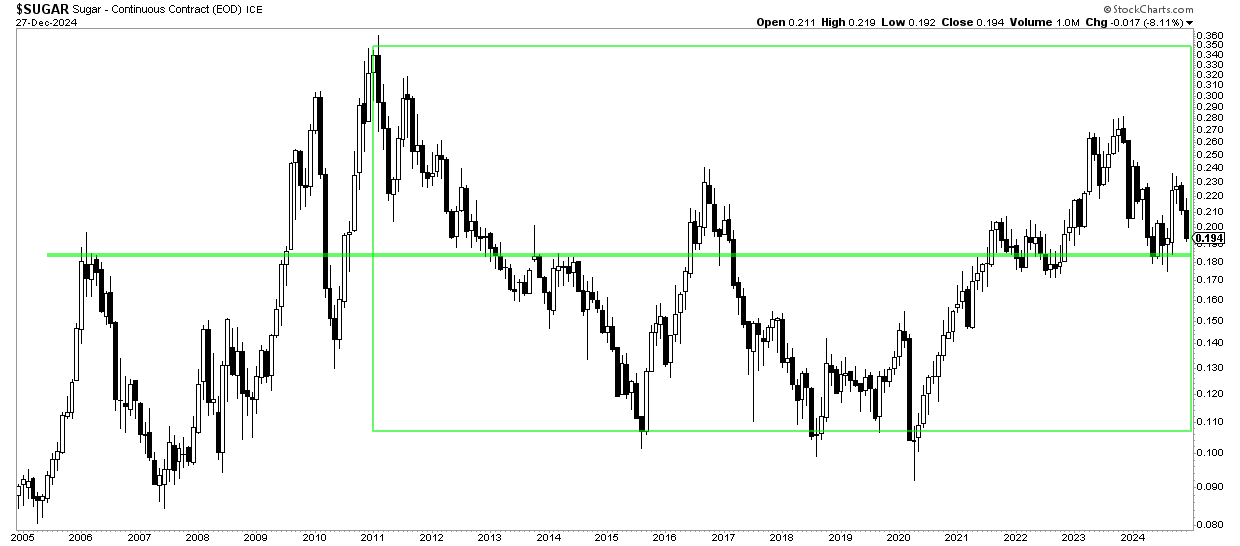
The monthly sugar price is registering a giant W-formation. We did visualize this with the green box on the chart. Below was the picture in June 2024, as it was a critical month for sugar as we’ll see in the next section.
The secular sugar price chart exhibits a long term bullish chart structure:
- This type of W-structure may take years to complete.
- As seen, the right-hand side of the W-structure was complete in 2023.
- In the first half of 2024, a pullback occurred which brought the price of sugar back to a secular and also very strong support level
Take-away written in June 2024 – The bullish reversal continues. As long as $18 cents is respected, the reversal remains very bullish. This, ultimately, suggests that a the previous ATH will be retested. Invalidation of the bullish thesis – a drop below 18 points.
This is what we wrote in June 2024 as commentary on below chart:
The daily chart over 7 years features the right part of the W-structure. Visibly, 22 points was a breakout level but 28 points acted as resistance. Readings below 18 make a bullish structure questionable.
December 29th – The current level must hold, in no way can we accept a drop below 18 cents.
Sugar Price Target For 2025
In order forecast a sugar price target for 2025, we identify structure on the sugar price chart.
The daily chart, over 3 years, clearly exhibits a rising trend channel.
Our assumption, given conclusions about the global sugar supply/demand situation, should continue to move within this structure. The current drop to 18 points is respecting the longer term rising channel, so the pattern remains bullish as long as sugar trades within this channel.
Longer term, though, we could see how the top of the rising channel might be reached, say by 2025. That’s a 100% rise from current levels, as a bullish scenario which is not unimaginable.
December 29th – The long term chart suggests that sugar may continue to rise within it long term channel in the best case scenario. Today, as we update this article, the upside is a bit more than 60% provided the rising channel holds on a 3-week closing basis.
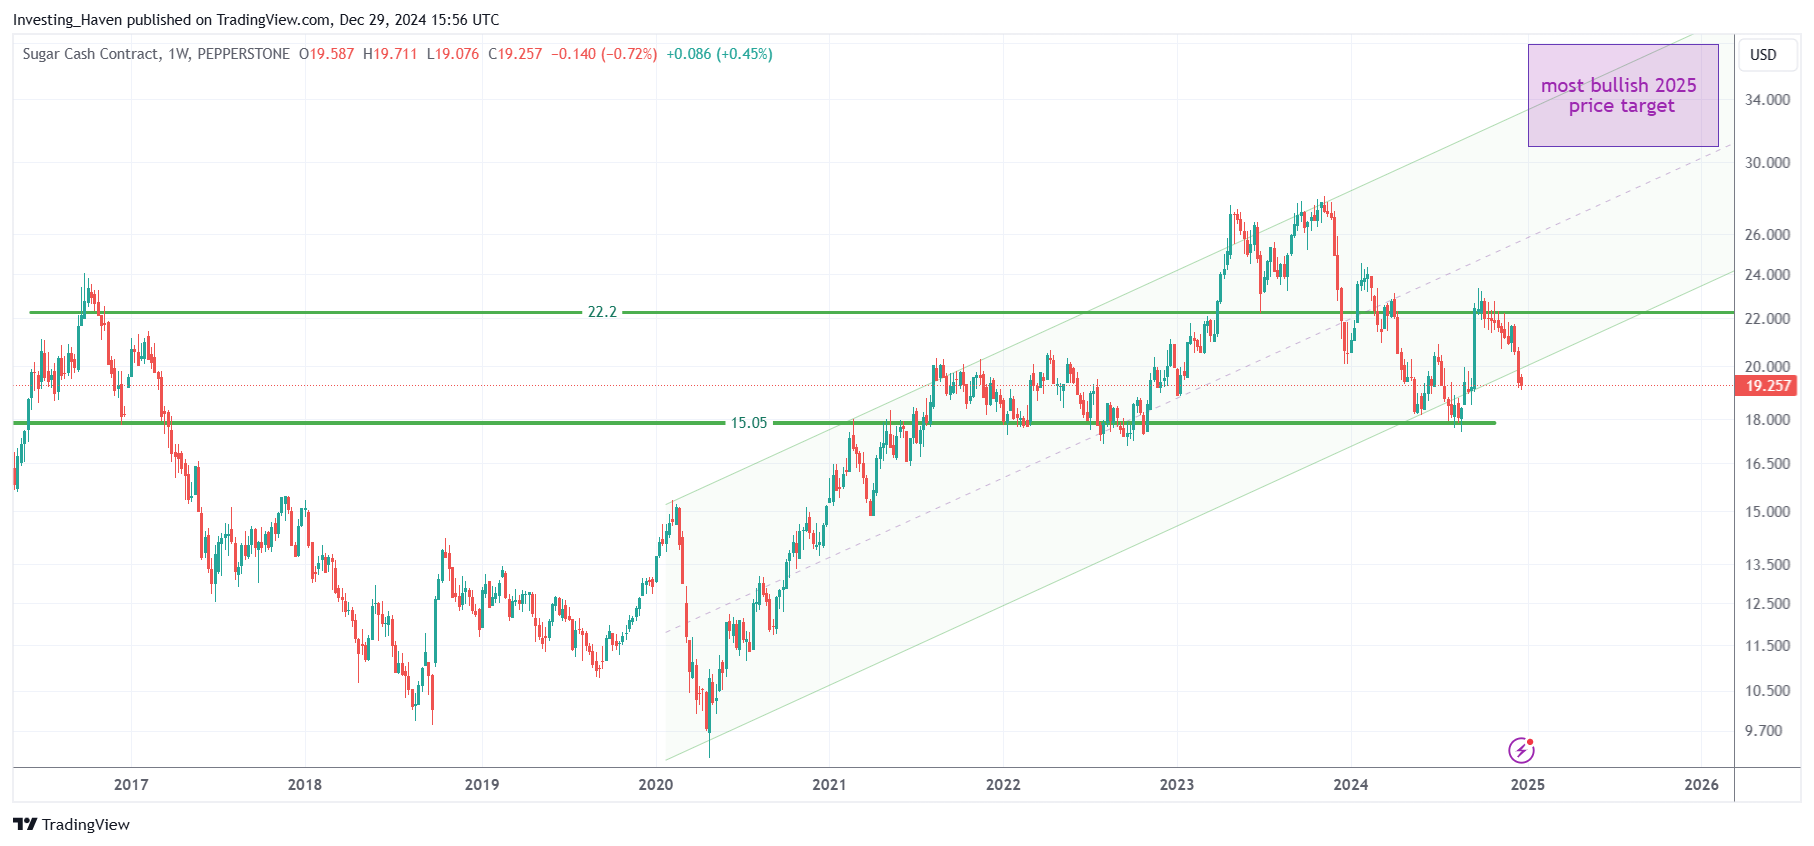
Therefore, we conclude that our sugar price forecast for 2025 is 36 points, an increase of slightly more than 50% from current levels.
Invalidation of our sugar price forecast: a drop below 18 points (on a 3-week closing basis).
Sugar Price Forecast for 2025 – summary
We believe that the price of sugar might move to up +60% over the course of the next 24 months. Therefore, our most bullish sugar price forecast for 2025 is 36 points.
The rising trend channel on the sugar price daily chart is the single most important dynamic for our sugar price forecast 2025 to be achieved.
Leading indicators are directionally bullish, but ultimately the dominant dynamic will be the continuation of the multi-year trend channel on the sugar price chart.
The bearish scenario will kick in once sugar falls below the multi-year rising channel, say below 18 points, for 3 to 5 consecutive weeks.


