
Silver can and will hit $50 an Ounce. Silver is working on a secular breakout, it’s a process. If successful, it willy imply that silver will hit $50 in 2025.
This article provides insights into the conditions for silver to hit $50. In sum, we do expect the big silver run to start in 2024 and move to $50 in two phases which will be reached at some point in 2025.
- The first target area: $34.70 to $37.70 (successfully hit in 2024).
- The second target area: $48 to $50 (forecasted to be hit at some point in 2025).
In October 2024, silver broke out to new multi-year highs when it cleared its secular breakout point $32.70. We consider $32.70 THE most important price point for silver.
Silver chart analysis combined with leading indicator analysis suggests that silver will rise to $50 once it clears $32.70.
As long as gold, a leading indicator for silver, remains in an uptrend, we can reasonably expect silver to overtake gold at a certain point in time, as explained here.
Can the silver price hit $50 an Ounce?
Yes, the silver price rally can hit $50 an Ounce.
It was hard to believe when silver was trading at $24 which is when we initially published this article in January of 2024.
The breakout level $28.80 remains the really important price point in order for silver to hit $50 an Ounce:
- On May 17th, 2024 silver broke out above $28.80, a crucial development.
- Since July 3d, 2024, silver confirmed a bounce from its breakout level.
- On September 19th, 2024, silver refused to fall to $28.80, the drop was heavily bought around $29.90.
Our forecasted $50 seems to be confirmed with the price evolution mentioned above. We confirm: ‘silver will hit $50 after successfully back testing the $28.80 level (this process may last up to 3 months).
Note that silver has a track record of powerful rallies. Consider the 1980 silver rally:
In part due to the actions of the Hunt brothers the price for silver Good Delivery bars jumped from about $6 per troy ounce to a record high of $49.45 per troy ounce on January 18, 1980, representing an increase of 724%. The highest price of physical silver is hard to determine, but based on the price of common silver coins, it peaked at about $40/oz.
While a silver price rally in which silver will hit $50 may sound like a significant increase, the reality is that it’s neither exceptional nor extraordinary.
Silver breakout confirmed – silver can and will hit $50
May 17th, 2024, is a day for history books – the secular silver breakout happened on that day.
This is one of the must-see charts. The silver breakout on the weekly timeframe.
This is a secular breakout.
And it is powerful.
Silver is clearly headed to $50. The chart pattern will now create a new dynamic, and it will enable silver to hit $50 sooner rather than later.
RELATED – Silver forecast for 2025 & beyond
February 18th – For as long as silver trades above its 38.2% Fibonacci level ($28.80) it is in bullish territory. Silver cleared $32.70 on October 18th, 2024, but got back down 8 days later (a Fibonacci number which confirms a failed breakout). However, silver is now at $32.70, and it printed a bullish micro-pattern right at $32.70. This is very bullish, and it may trigger bullish momentum in March/April for the long overdue silver rally to $50.
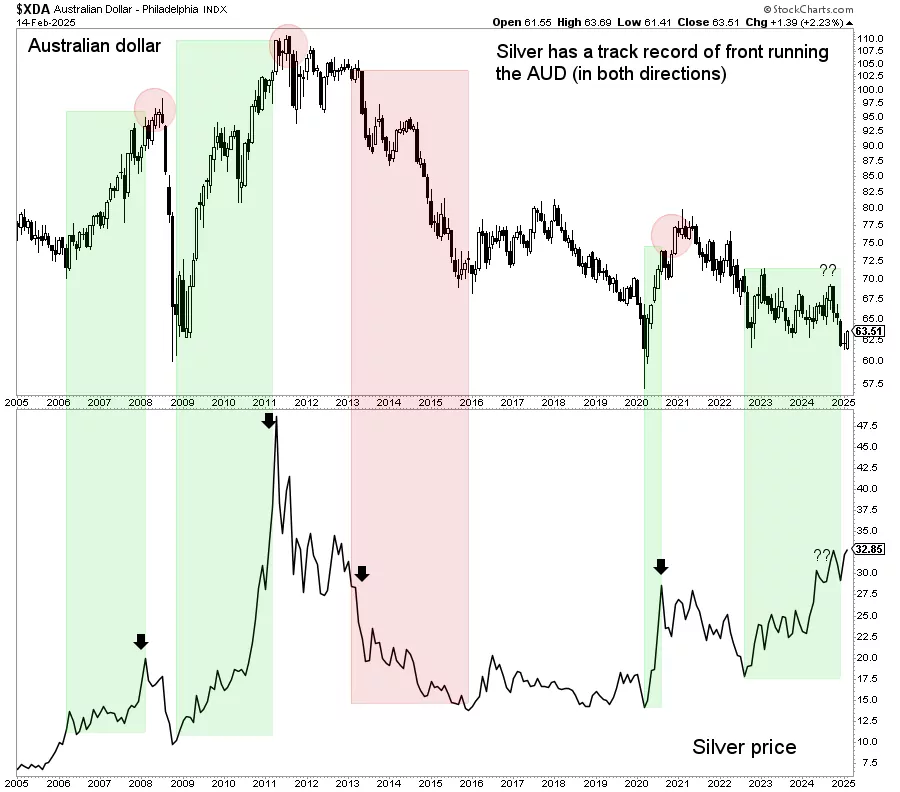
Silver – bull market confirmation by the AUD
The Australian Dollar is objectively confirming that silver can and will hit hit $50 an Ounce.
We explained this in great detail in several premium research notes to our precious metals followers (link to our premium research materials at the bottom of this article) – the Australian Dollar and silver are correlated.
Stated differently, the Australian Dollar has the ability to confirm silver’s bullish intention.
In a recently published article 5 Must-Read Insights For Silver Investors we wrote:
Silver’s bull market was objectively confirmed in the currency market.
It’s important to pay attention to intermarket dynamics. A strong and reliable bull market in any asset or stock is always objectively confirmed in another market.
In the case of silver, we noticed a confirmation in the Australian Dollar (AUD, also Aussie), the most commodity sensitive currency. When the Aussie goes up, it creates (‘confirms’) an environment that is favorable for commodities.
This is how it works:
- The silver to AUD ratio is an important intermarket measure.
- The ratio chart structure should be assessed.
- In case of bullish reversal, it implies that the Aussie is confirming silver’s bull market.
- The opposite is true as well.
Below is a chart exhibiting the correlation between silver and AUD.
February 18th – The AUD is setting a triple bottom. As long as the AUD respects its triple support, it will be supportive for the price of silver. This indicator confirms the thesis that silver will move to $50 an Ounce.
Silver supply shortage
In our analysis silver shortage, we stated:
The looming silver shortage stands out as a ticking time bomb. Despite COMEX silver price setting, the law of supply and demand will eventually prevail. As we approach a true silver supply shortage, the silver market’s true potential awaits, ready to reshape the price setting dynamics and elevate silver to new heights.
Indeed, the silver shortage is developing into a really serious problem. It seems to be getting worse with each passing month, as evidenced by recent data.
Continued evidence of silver demand on the rise driven by industrial activity:
We believe that the physical market ultimately will take over control. Price discovery, orchestrated from within the silver futures market (COMEX) is not a sustainable price discovery dynamic.
Unless this physical silver market supply shortage resolves, which is very unlikely, it seems inevitable for silver to hit $50 an Ounce.
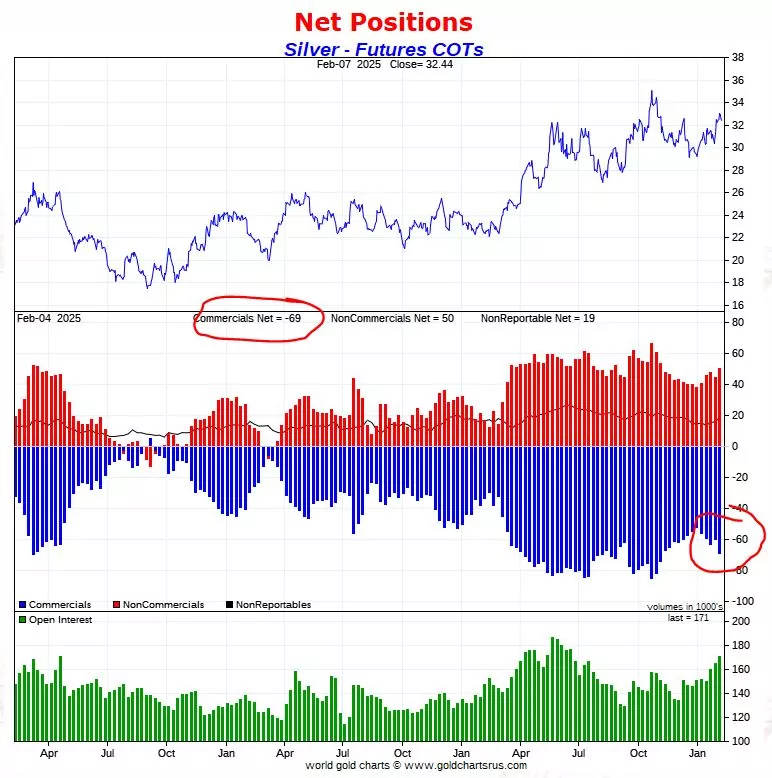
Silver COT analysis
One of the tools at the disposal of traders and analysts is the Commitment of Traders (COT) report, which presents a snapshot of market sentiment based on the positions of different trader categories.
February 18th – The silver COT report has shown some improved readings in Dec/Jan:
- Net short positions of commercials came down – this is much less bearish compared October;
- The bullish silver thesis will materialize if silver continues higher with price drops that are short-lived, with inverse behavior on the net short positions of commercials chart.
There was too much positioning on the short side by commercials, until Oct 2024. This has resolved lately which is a promising long term evolution.
For a detailed explanation of the mechanics conveyed by this chart, we recommend reading our premium gold & silver market reports.
On the flipside, obviously, comes the manipulation thesis. Silver is experiencing a supply deficit, for 3 years in a row, as explained above. How comes the price of silver is more than 50% below its ATH while all other commodities exceeded their 2007/2012 ATH?
Silver chart: the rally to $50 now officially started
Chart analysis often reveals patterns that provide valuable insights into future price movements.
The 12-month consolidation, since May 2023, hints at a bullish chart reversal which, if confirmed, should resolve to the upside in the current or next 3-month cycle (details about cycle analysis are shared every weekend in our premium gold & silver research service).
Such patterns are considered significant as they indicate a shift in sentiment from bearish to bullish or vice versa. If the pattern breaks to the upside, it will confirm a secular breakout attempt. This breakout might signify the beginning of a new bullish phase for silver, possibly setting the stage for the anticipated rally.
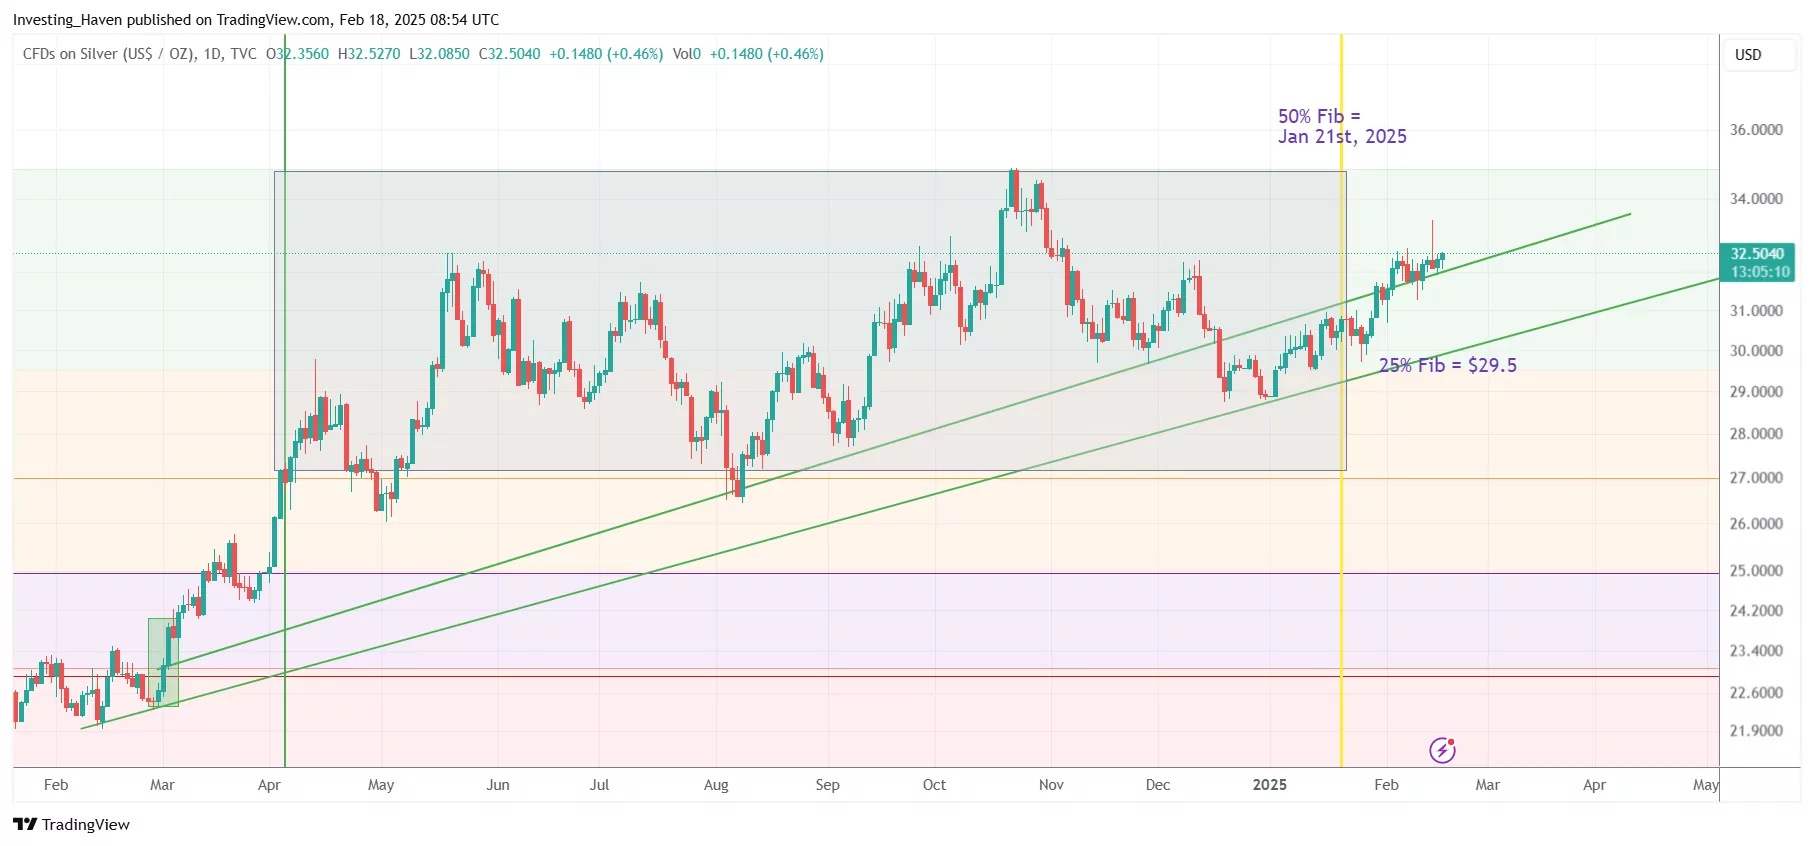
Short term silver chart
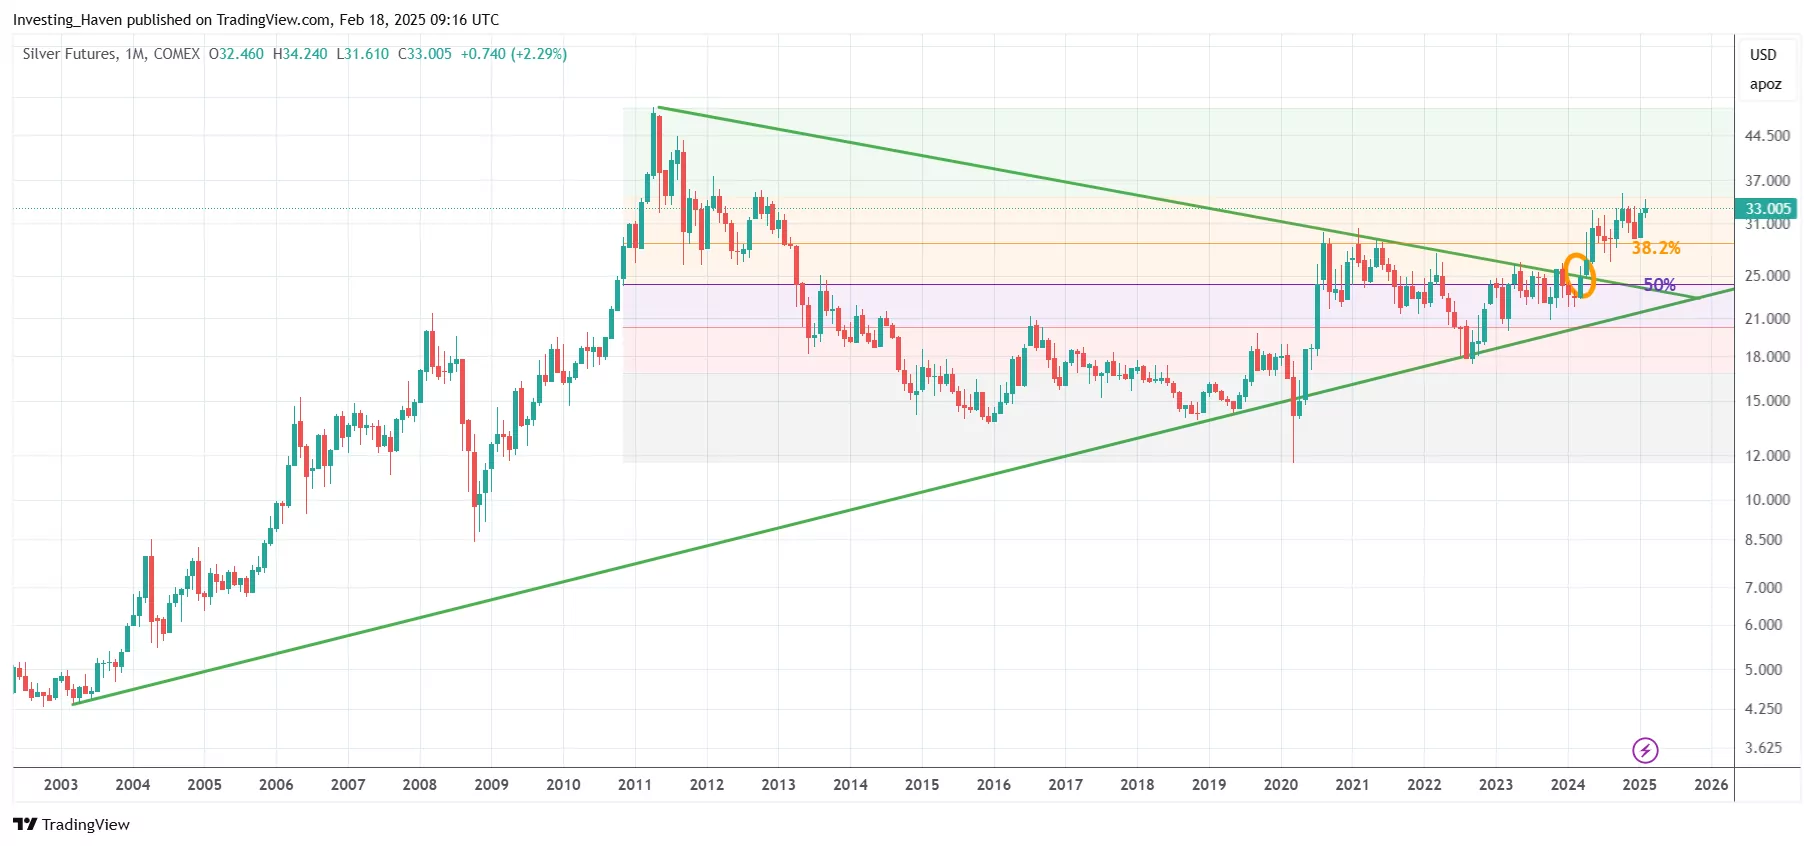
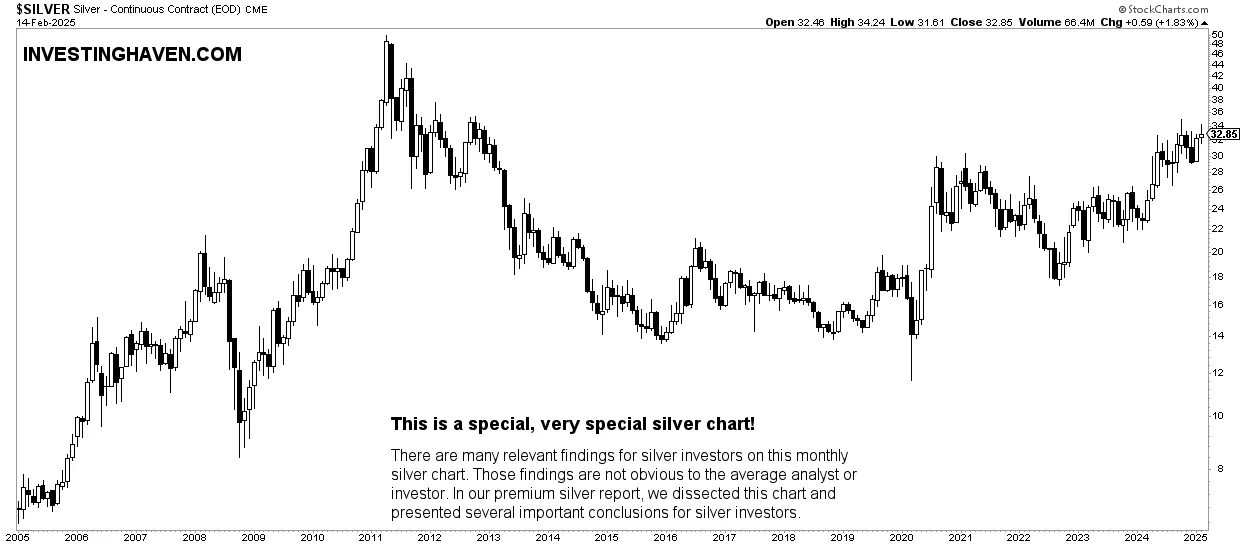
February 18th – The silver chart, both short and long term timeframes, confirm the importance of $32.70. This is undeniably THE most important price point on the silver chart(s). Moreover, THE decision date January 21st, 2025, coincided with a bullish reversal confirmation, right above key Fibonacci support. Our take-away: silver will hit $50.
Long term silver chart
Moreover, the medium term oriented silver chart (above) should be complemented by the secular silver chart (below). As seen below, silver is now testing an epic secular breakout point. The falling trendline since 2011 is being tested for the 7th time in 4 years. This time might be different as the secular pattern nicely aligns with the cycle chart shown above.
February 18th – This chart confirmed what we outlined above: support was successfully tested in recent months. The breakout above the 2020 monthly candles (in the $28.80 to $32.20 area) is being tested in Q1/2025.
Two stages of the silver price rally to $50 an Ounce
It’s important to understand that predicting a price rally to $50 doesn’t mean a single, uninterrupted climb. The journey could involve two distinct stages.
The initial stage might see silver moving toward $34.70, driven by a combination of technical and fundamental factors.
Once this stage is achieved, the path to $50 could follow. It will be supported by strengthening market sentiment, potential supply-demand imbalances, and external catalysts.
When exactly will silver hit $50 an Ounce?
Back to the original question of this article – when exactly will silver move to $50?
According to our latest silver price seasonality charts:
- Each year January and October: October is a strong month while January has shown a decline in its seasonality strength in recent years.
- Each year April and December: There is a marked improvement in these months in recent years.
Several strong months in silver can reasonably be expected. If we map the silver chart setup to silver seasonality, we expect silver to hit $50 an Ounce in the first half of 2025, before May 2025.
Conclusion
As investors eagerly await silver’s rally to $50, we derive the first half of 2025 as the ideal period for silver to hit $50 an Ounce.
Precise timing remains uncertain. However, a well-rounded perspective can be gained by:
- monitoring the silver COT report;
- analyzing price patterns;
- considering historical context;
- and acknowledging the potential for a two-stage rally can offer.
By incorporating these insights and analyses, investors can approach the silver market with a more informed outlook.
February 18th – The news now suddenly is the ‘Trump trade unwind’ favoring gold (consequently also silver).
Premium Silver Price Analysis
We help precious metals investors by providing detailed gold & silver price analysis as a premium service. In it, we cover leading indicators of the gold & silver price, every weekend. Sign up to the premium service – Gold & Silver price analysis >>