Does anyone recognize this sequence of news events: Bitcoin is bullish, Bitcoin is bearish, Bitcoin violated $10k, Bitcoin rises as Bakkt announces launch date, Bitcoin down as Ethereum founder does this or that, and so on … It is so easy to get caught up in the endless stream of news which changes with the weather. Our point is that day-to-day noise harms the mental and financial health of investors. There is one, and only one, antidote: long term charts. In this article we focus on the long term Bitcoin chart. Yes, this still points to our Bitcoin forecast of $25k to materialize.
Let’s just focus on the chart in this article. Fundamentals in the crypto market may be awesome. However, more often chart analysis is more important than fundamental analysis.
In the end all we want is the charts to follow fundamentals. That’s why chart analysis happens constantly, while fundamental analysis only sporadically!
The long term Bitcoin chart helps cut through the daily noise of social media, financial media, and opinions / assumptions / desires.
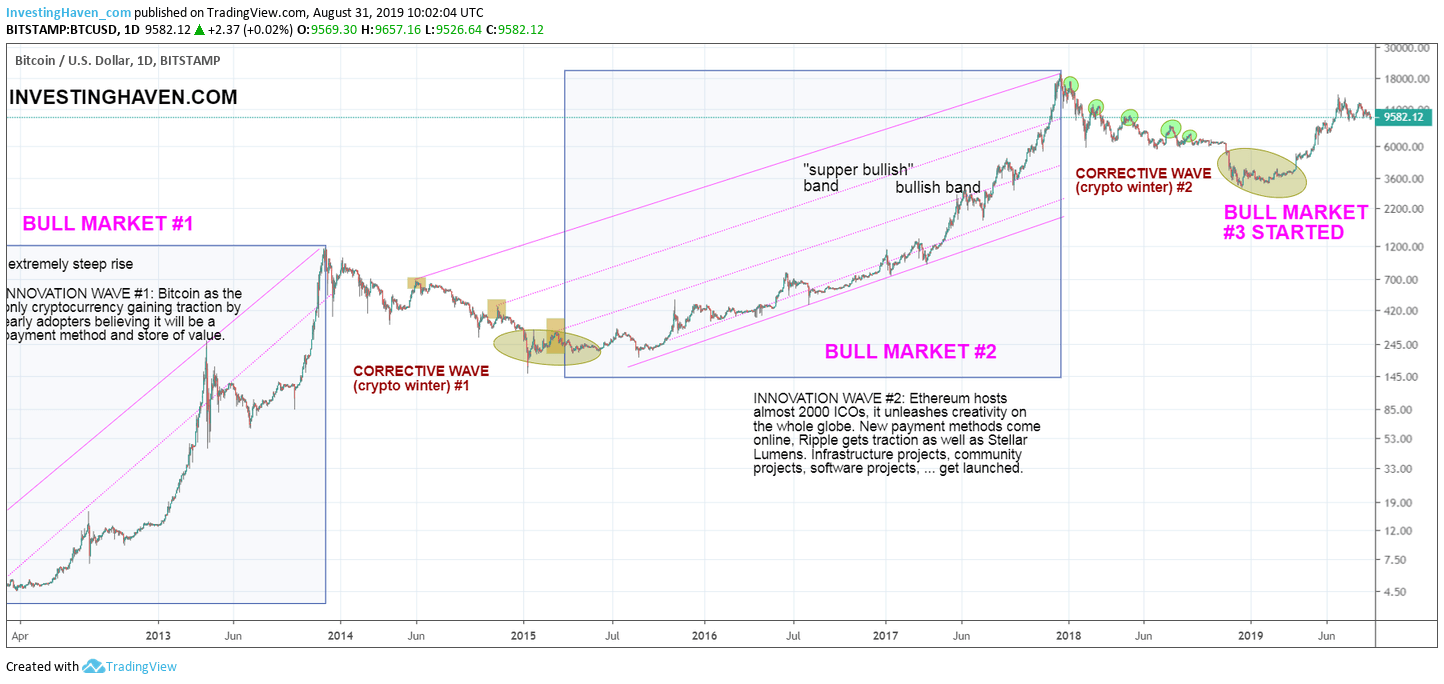
Below is the Bitcoin chart since Bitcoin’s inception. The 2 bull markets stand out, but the new bull market which started on April 2nd, 2019 is also visible and has a powerful look!
This chart helps put the ongoing hesitation in Bitcoin into perspective. Because in the end the rise of the current bull market is pretty steep. Even if Bitcoin would undergo more weakness we would still have a strong bull market which is indicated with #3 on this chart.
Again, the long term Bitcoin chart filters out noise, and that’s what investors often have to do.
As far as our previous call goes for August 28th, 2019 Bitcoin: Why August 28th, 2019 Is One Of The Few Crucial Days In 2019 we have not seen a confirmed trend change as of yet. However, we believe we are very close to this point. If may happen any day as of now. The next few days may be decisive for the short to medium term trend. The long term trend though is clear, and it is shown on below chart!