Broad markets and cryptocurrencies are preparing for more volatility, as explained in Leading Indicators Confirming A Pullback Is Underway. The intensity will not be like June nor September of last year, it will be closer to the December pullback. That said, we can clearly see that the next wave of selling will come with a buy opportunity in Ethereum (ETH). This is consistent with our crypto predictions for 2023.
Earlier this month, we predicted that leading indicator Bitcoin was unable to move higher. As explained in Bitcoin: Resolution Comes After Chart Tension Is Cleared:
That said, what do we see on the Bitcoin chart currently? First, BTC did hit resistance, strong resistance. Any market that is unable to clear resistance will move back to support before it can re-attack resistance. Second, several trendlines coincide in the 19-22k area in the period February & March. This is the ‘tension’ we were talking about in our introduction. As seen, as of April, there is only one trendline above 22k which suggests that IF Bitcoin is able to get back to 23k in April/May it should be able to clear that resistance level.
When both time and price meet resistance, when there is tension on the chart in that time/price combination, there is simply no way that a market can move higher.
It’s a very simple principle that most investors nor analysts are able to ‘see’ although it’s there, on the chart, visible, for anyone with an open mind.
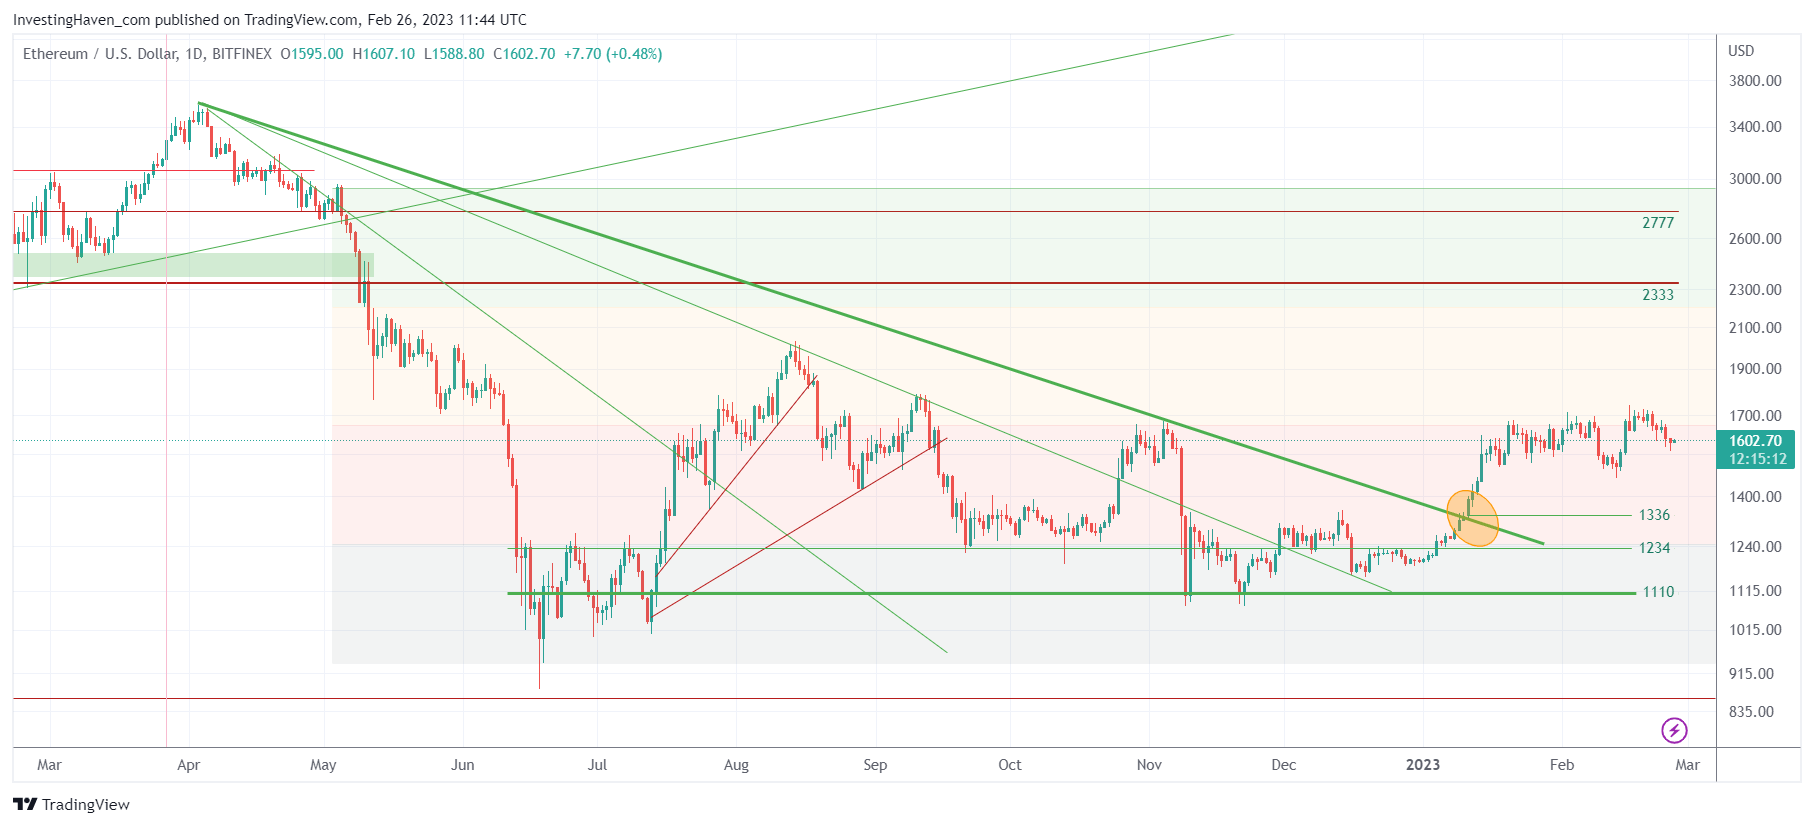
That said, the Ethereum chart is also pretty clear. What we observe is straightforward:
- The 1549-1658 area has lots of resistance.
- It’s the 3d attempt of Ethereum to clear this area since last summer.
- We suspect that the 4th attempt will come with a breakout, but only in 4 to 6 weeks from now.
- Everything will depend on how low ETH will fall. If support at 1336 will hold, in March, we are convinced that ETH will clear 1658 not later than April of this year.
Overall, what we do like most about the Ethereum chart, other than the ‘details’ outlined above, is that tension is disappearing. The candles are getting smoother, the candles are smaller, the volatility is disappearing. Needless to say, if volatility will pick up (which we expect to happen in the next few weeks) the picture might change but you can clearly see how this current period is getting smoother, certainly when compared to last summer and fall.
In our crypto research service, we will be tracking relative strength in our watchlist of 30 tokens. We also do expect to hit at least one unicorn (a multi-bagger) before the start of the summer.