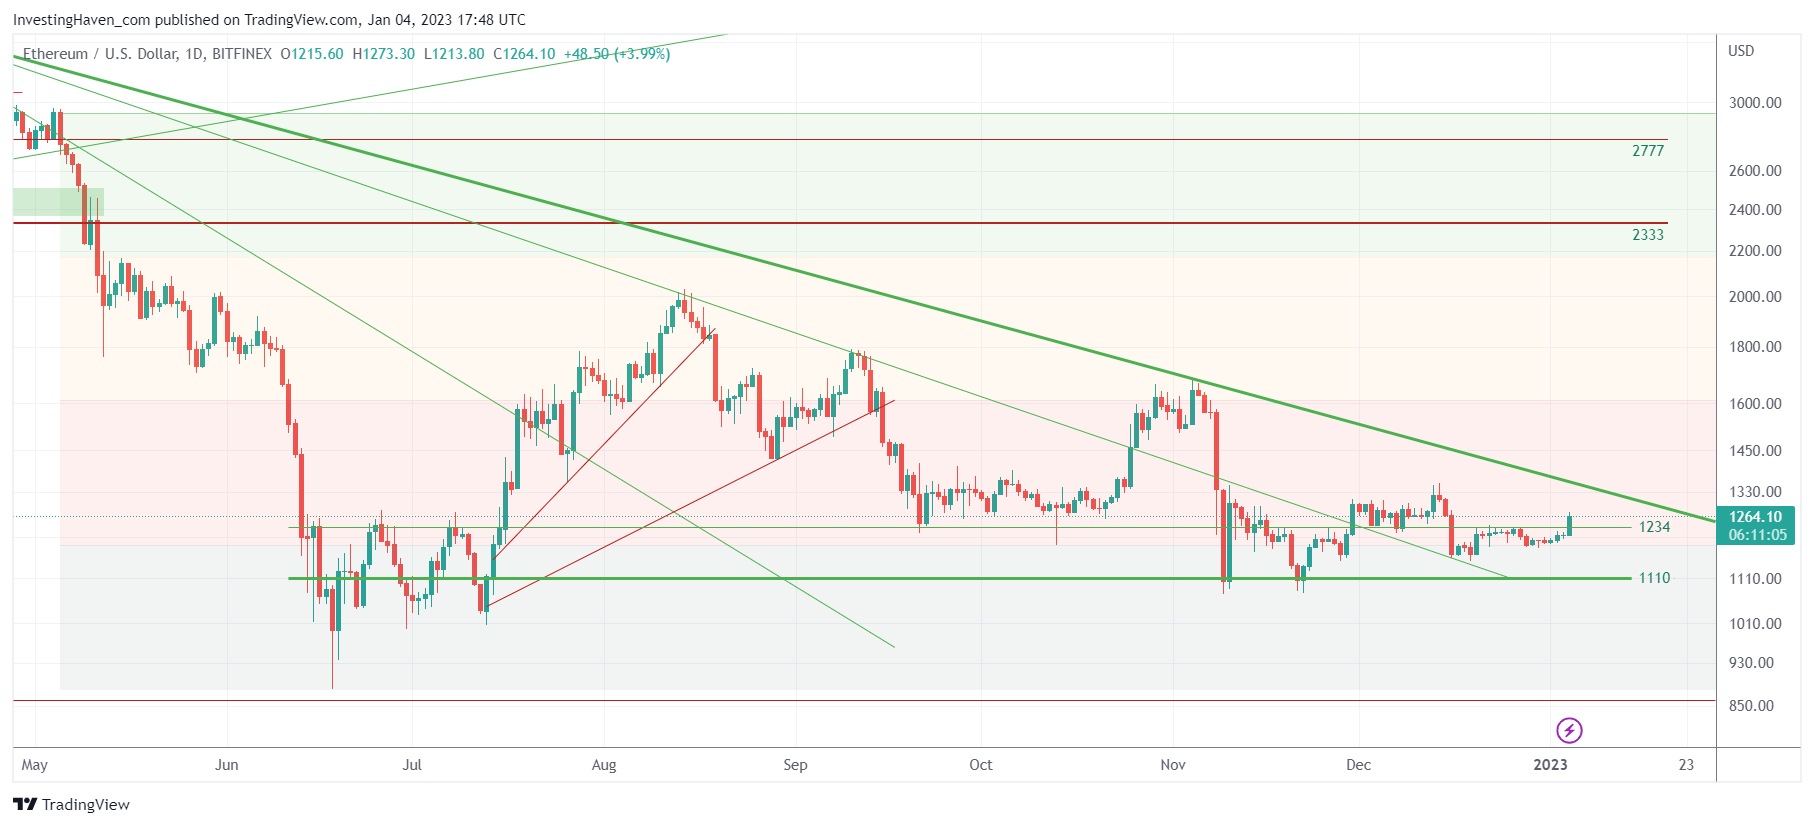
Ethereum seems to be confirming a local bottom. But the really big topic is the coming test of resistance, very strong resistance in fact. Whatever happens around 1330 USD on the Ethereum chart might be crucial not just for Ethereum but also for the entire crypto space. It might also confirm to which degree our crypto predictions start materializing already now vs. later in 2023.
The ETH chart might be setting up for an epic double bottom.
The chart shows very early signs of improvement.
However, the real test is not the confirmation of the recent lows. The real test will be the behavior of price once the 2022 falling trendline is tested.
As seen on the daily ETH chart, the falling trendline comes in around 1330 USD (in the next few days and weeks, moving below 1300 in February and later).
As seen, early November, the same trendline provided too much resistance. Not good, the ‘reason’ was the SBF drama. Will this time be different?
If anything, the chart has only improved since the failed breakout of early November. The longer a consolidation, the more power develops for the next run (higher or lower).
We believe that this double bottom setup will hold. IF this will turn out to be true, it will be a very solid setup for a longer term move in ETH. A long term position in ETH is justified provided the 2022 lows are respected on a 3 to 5 day closing basis.
We are closely tracking ETH as well as other tokens in our premium crypto service >>