It is only a few months ago when we wrote our Ethereum Price Forecast for 2020 and 2021 with a long term price target of 510 USD. Now so far Ethereum’s price visibly went ‘against’ our forecast. Does it mean that our forecast turned invalid? The answer is ‘indeed, for now it is invalid’. Here is why, and what to expect going forward.
If we look back at the conclusion of our Ethereum forecast we would summarize our thinking with this quote:
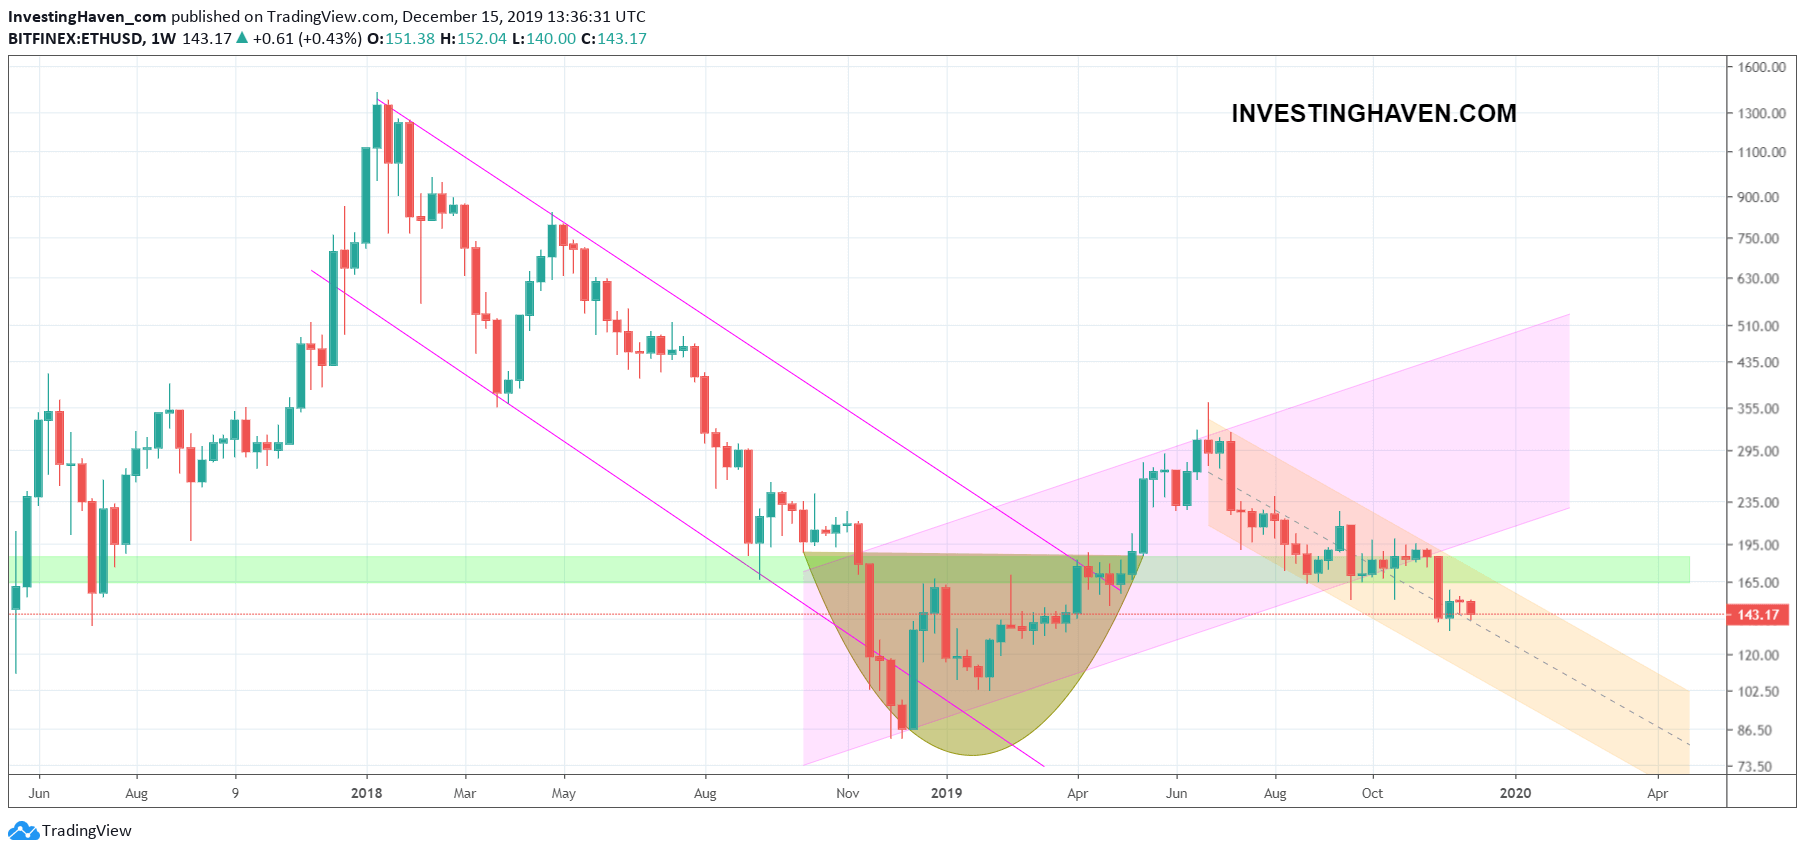
Leading indicators suggest a bullish Ethereum price forecast for 2020 and 2021. Based on the long term Ethereum chart we derive a price target of 510 USD. In 2017 there was a hugely bullish move with an epic Ethereum crash (falling channel). However, the new channel that is visible on Ethereum’s price chart is this rising channel (purple shaded area). The reliability of this new rising channel is pretty high as we see already 3 touches.
A few weeks ago this rising channel which started a year ago got broken to the downside!
Now then why didn’t we say this sooner, and did we wait 3 weeks? That’s because we always need 3 consecutive weekly closes in order to confirm a breakout or a breakdown.
For Ethereum it is now clear that much more work is needed to get back into a bullish chart pattern. In fact it will be primarily Bitcoin that will set the trend. As said today in Bitcoin: Critical Fibonacci Level At Risk we watch closely what Bitcoin does in order to set the overall crypto market trend.
So yes Ethereum’s future, and our new Ethereum forecast, will depend on Bitcoin, that’s indeed what we are saying. To be continued!