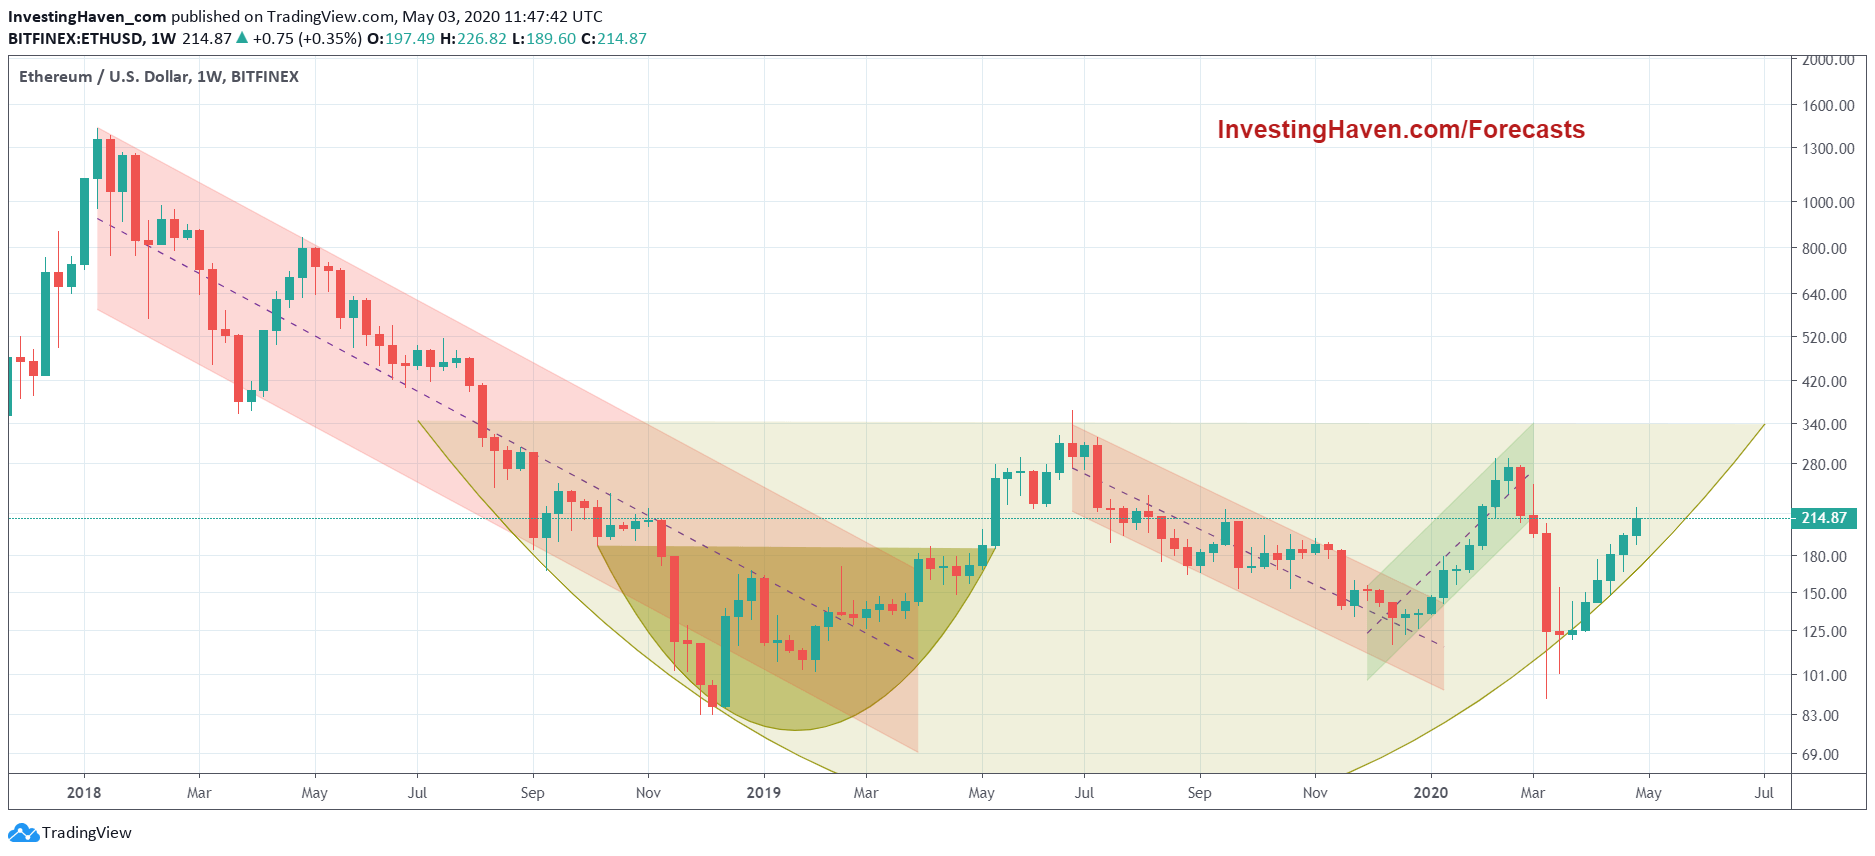
Many crypto investors reached out to us in recent weeks asking about Ethereum. Even though we do not list Ethereum as a top cryptocurrency in our crypto investing service we still cover it in our top crypto chart list. Is Ethereum interesting to invest in? Is it justified to hold long term positions in Ethereum? Is it worth opening a new position in Ethereum? Our default answer was that Ethereum’s price chart looks really cluttered, and does not ma any chartist too excited. However, as per our investing principles, it is imperative to always start with the big picture. Ethereum’s long term price chart is featured in this article. Although the daily chart is really messy, the weekly is such a simple read … if you get the patterns right.
The weekly Ethereum chart, as opposed to the daily chart, is simple and concise. There are 2 simple patterns on this chart: the 2018 bear market and the 2019/2020 reversal pattern. The latter is a consolidation, but as per this chart a pretty wide consolidation. That’s why 99% of investors will not ‘experience’ this as a consolidation, it really feels very ‘bad’ if you hold Ethereum as an investor.
Interestingly, the reversal pattern (in yellow on below chart) has several shorter term trends (from a weeks to a few months): a reversal early 2019, an uptrend mid-2019, a downtrend in the latter part of 2019, an uptrend early 2020, the Corona crash, and a new uptrend currently. That’s 6 trends, but all within the context of the long term reversal.
What does all this mean?
Benefit of the doubt to the long term crypto investor who is able to buy-and-hold. Not many are able to withstand the volatility in the crypto market, and 99% of crypto investors buy and sell way too often.
In our crypto investing service we bring in stability, and only occassionaly buy and sell a position in our long term portfolio. We do take one or two shorter term trades per year though, but they are very precise in terms of entry/exit points. Note that below chart is one of many dozens of annotated, very precise charts we feature in our crypto investing service. All this is based on advanced charting, and we know as a fact that there is hardly any other place where crypto investors can find similar charts like ours.


