
Crypto completed a nice but short lived rally. We said so in our crypto investing research service a while ago: 3 bearish weeks (Jan 4th till 24th), 3 weeks of relief (Jan 25th till Feb 15th), followed by 3 bearish weeks. It’s playing out as expected. This also implies that the first days of March should come with a ‘buy the dip’ opportunity. If anything, we believe some coins are worth considering but only a select few. That’s because 2022 is the year of hyper-bifurcation in crypto markets as explained in our crypto forecast.
Interestingly, in the last 4 months, we see that Bitcoin tends to act as a leading indicator for broad markets.
It was around November 9th that BTC rejected to move higher, and one week later it confirmed a failed breakout attempt. Stocks followed Bitcoin’s path, with one week of a delay.
Early January, Bitcoin started leading broad markets, again.
On January 24th, the day of capitulation selling, Bitcoin was the first to bounce, a few hours before the rest of the market.
The million dollar question is whether crypto will bottom out before stocks, around the end of the month. We don’t have an answer to this questions, not yet, because we really need the ‘exhaustion selling’ characteristics to appear on our charts. Our premium members will receive the confirmation as soon as we get it from the market.
Our call from last weekend was spot-on First Lower Before Moving Higher. This is what we said last week:
The fact that BTC has been rising for 2 weeks is meaningless. What really matters is the bull trend confirmation, and it comes with a break above the long term rounded bearish topping structure. It is a structural rise that is meaningful (as opposed to the number of days of a rise). That said, even more interestingly, our algorithmically defined buy signal for medium term oriented BTC investments came in *exactly* at the same price point as the resistance that was hit on Friday Feb 11th. The market rejected chart resistance + our buy signal, there was no confirmed buy signal, very accurate chart and algo readings. Note that this algorithm is created by InvestingHaven’s research team, and is used in the soon to be launched crypto auto-trading service.
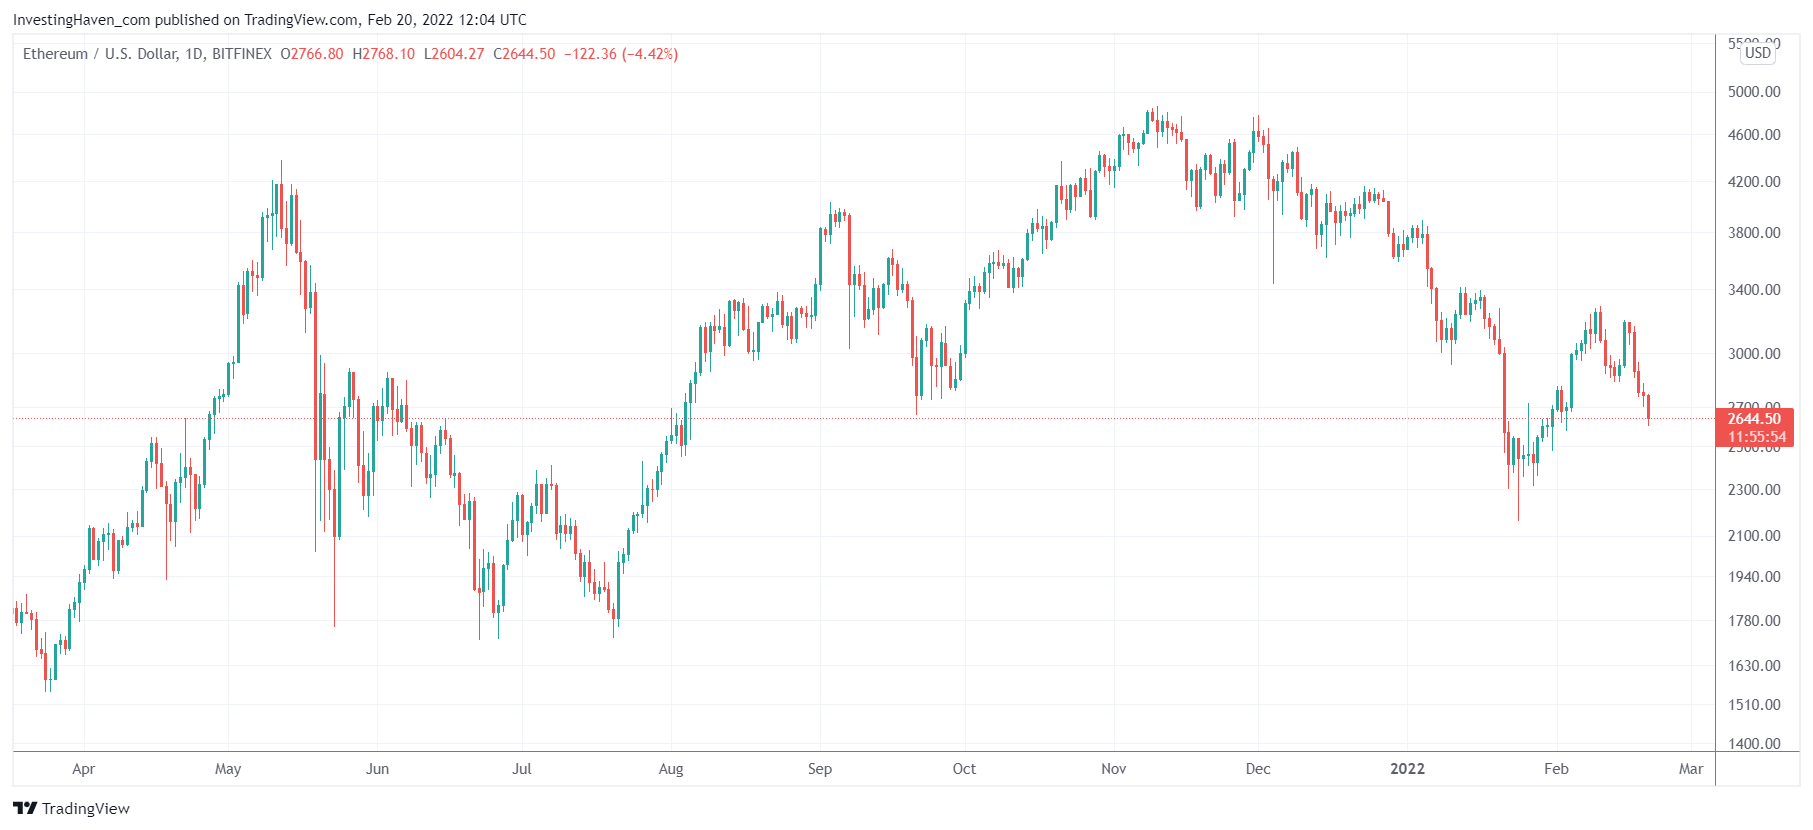
In the meantime, we see a potentially constructive setup on the Ethereum chart.
This is the daily chart without annotations. It is clear that a successful retest of 2300 would result in a bullish reversal pattern. It would be an interesting point to consider adding to positions, but only after the triple sell-off confirmation within the typical 72h time window (all these concepts are explained to our premium members as soon as they appear on our charts).
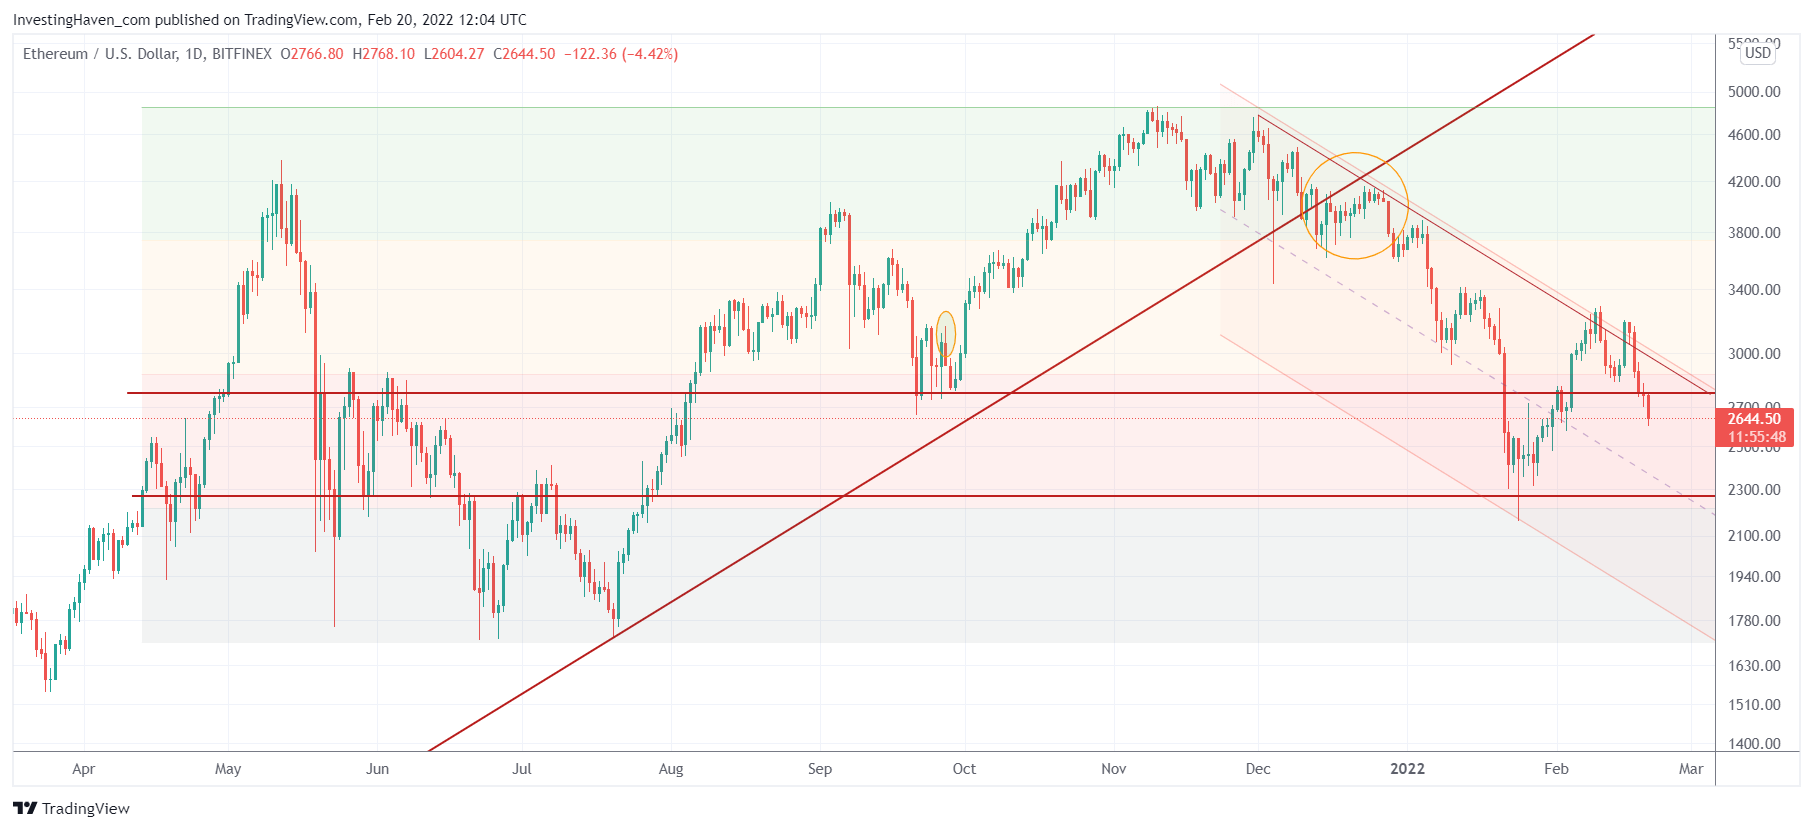
This is the same chart with our annotations. The falling trend channel which started early December will either lead price to 1700 or the January lows will hold.
If anything, ETH priced in BTC is starting to show a really interesting pattern. A 9 month support trendline comes in around the end of this month, right at the January lows. A double bottom type formation right at the green arrow would be bullish for ETH.
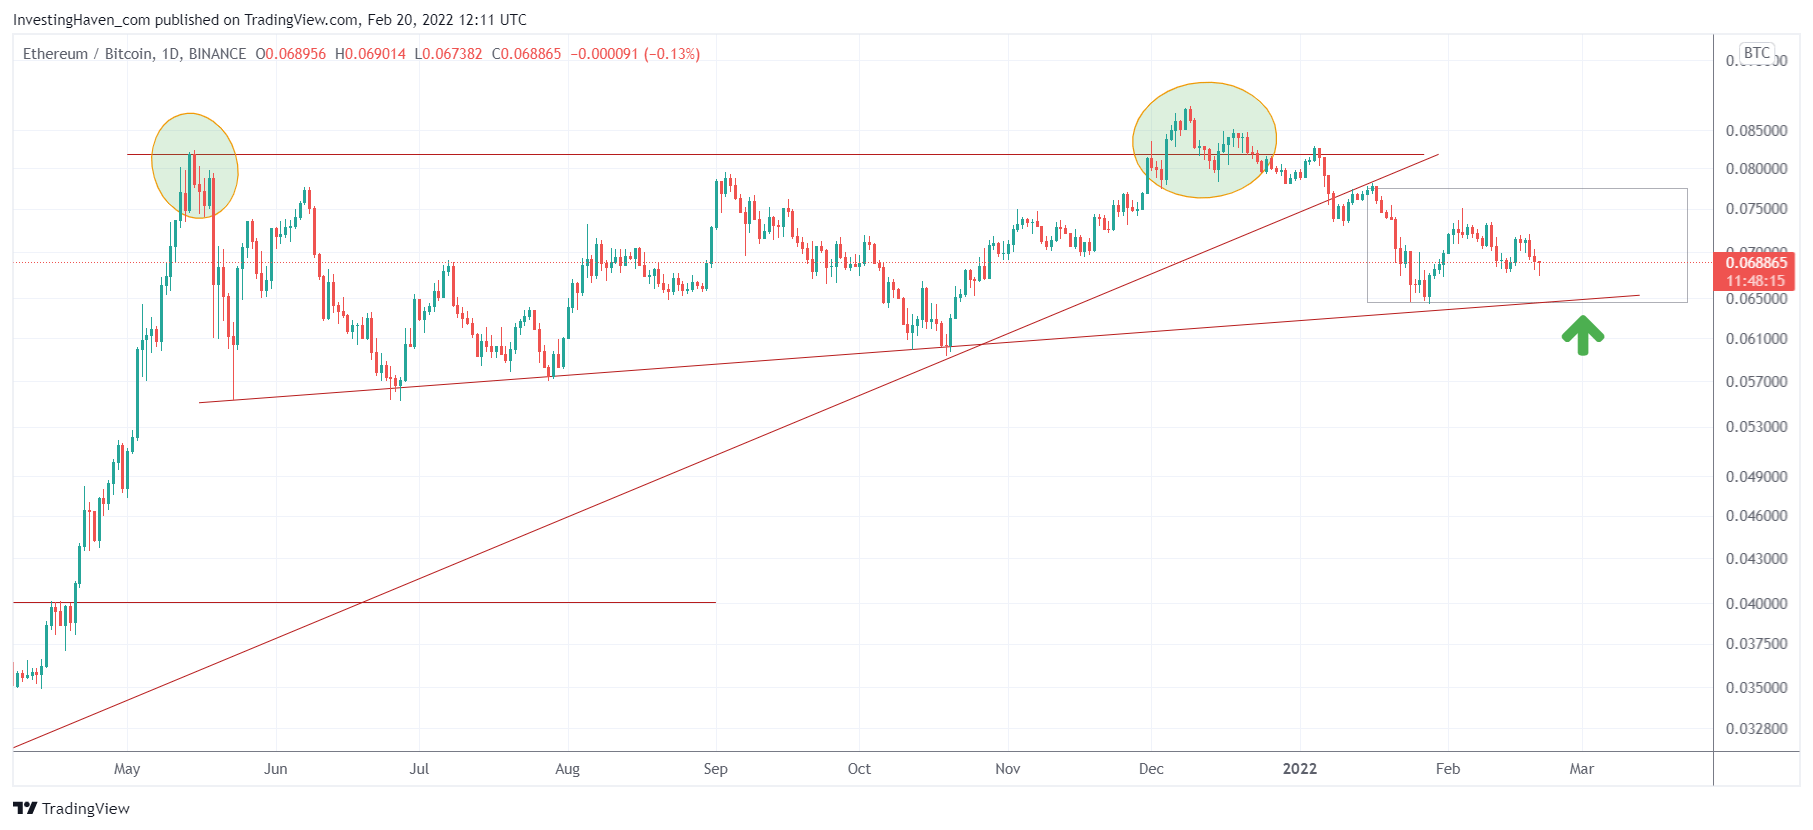
A double bottom on the ETH chart (support at 2300) and the ETHBTC chart (0.065) would confirm a strongly bullish reversal. If support breaks, we can reasonably expect a bearish reversal. We will know in about 2 weeks from now!
In our premium crypto service we will flash a ‘buy’ as soon as we believe a ‘buy the dip’ is justified. Moreover, we are about to launch a pilot with BTC and ETH auto-trading.