
It is starting: a major move in XRP. It can start any moment as of now. Today’s alert in our crypto investing research service has very detailed XRP charts with detailed readings, must-see XRP charts (available in the restricted area for any new or existing member). Our XRP forecast 2023 is likely underway.
[Ed. note: This article was originally written and posted on March 19th, 2023. We did add two up-to-date charts and a few paragraphs on May 28th, 2023, as indicated throughout the text and below the charts.]
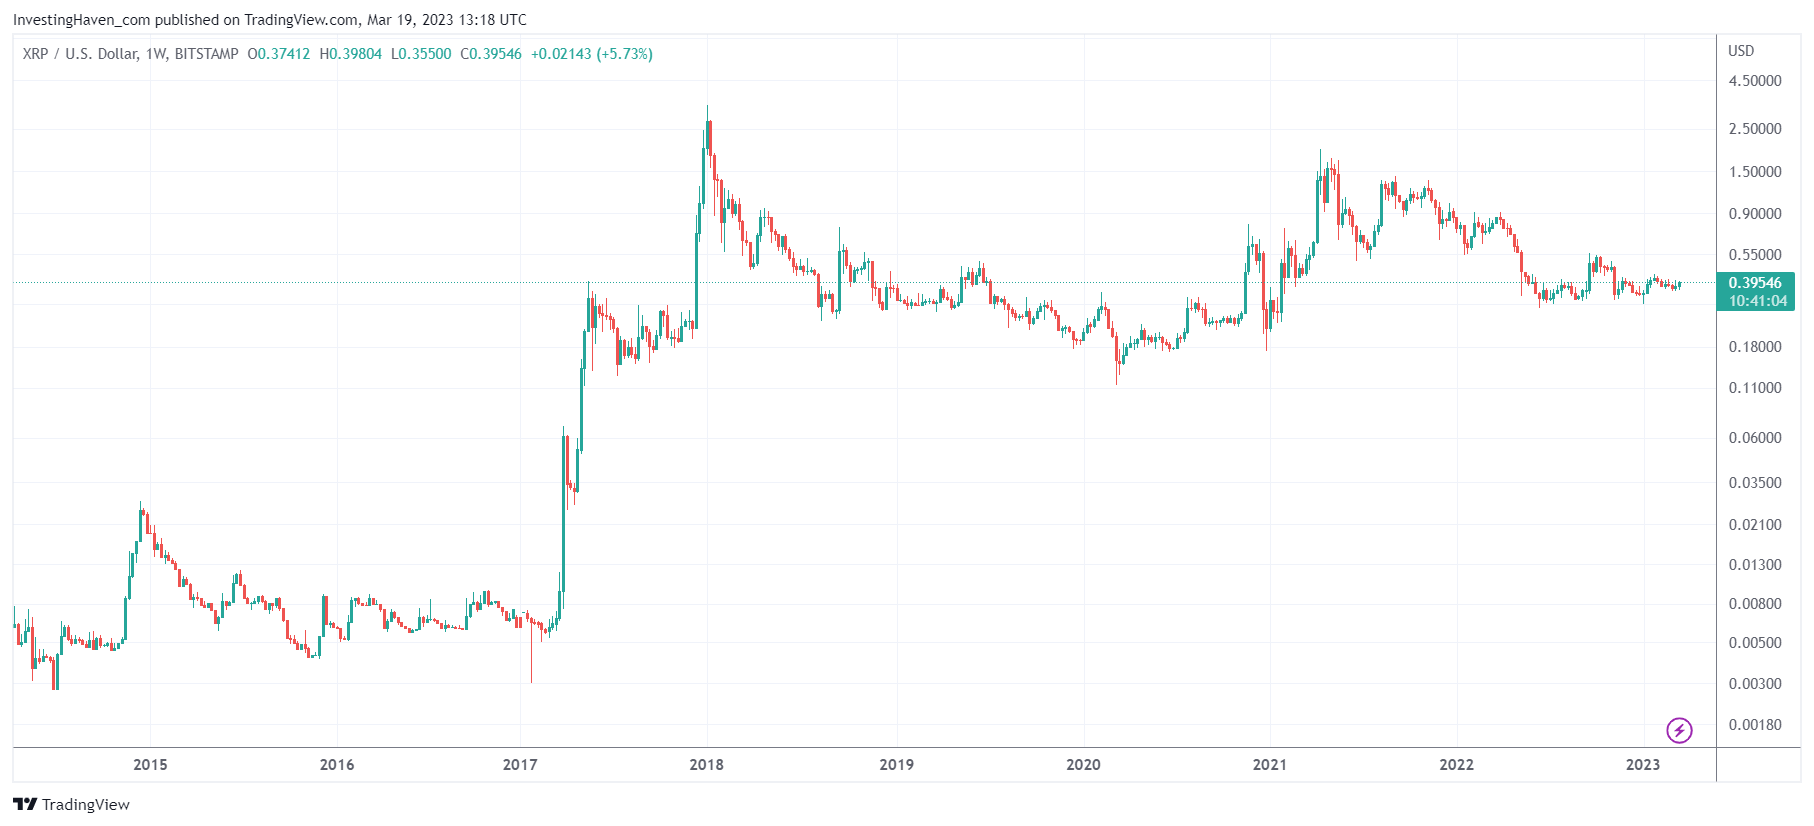
We pick out one specific XRP chart (source: today’s research note to premium members). It is the weekly chart which shows the long term XRP price structure.
The weekly XRP chart has a very simple structure: a W reversal. More importantly, it has all the characteristics of a ‘perfect W reversal’.
What does that mean: a ‘perfect W reversal’? Chart-wise, it is a long basing pattern with a higher low in the right part of the W structure. That’s the analyst viewpoint, less relevant for the investor. What really, really matters to investors it the outcome of the pattern (read: upside potential).
Any ‘perfect W reversal’ has a tremendous upside potential, especially if it’s a long (wide) pattern. The longer the basing pattern, the more power the market is able to develop once the move higher starts.
The upside potential is much higher than the 2021 highs, potentially. A W reversal tends to move to the initial highs. IF and WHEN it’s able to exceed those initial highs, the sky becomes the limit.
Astute readers might argue that a 5 year basing pattern is not very long, consequently the upside potential of XRP is contained. We thoroughly disagree with that argument. That’s because there is no other cryptocurrency that has a 5 year basing pattern, similar to the one of XRP.
The general rule of the thumb is that crypto, being the most volatility asset class in history of markets, is moving 10x faster than broad markets. That’s why a 5 year consolidation, like the one of XRP, translates to a few decades when compared to traditional stocks.
Interestingly, if we look at the long term structure, not any other crypto chart looks as strong as the one of XRP.
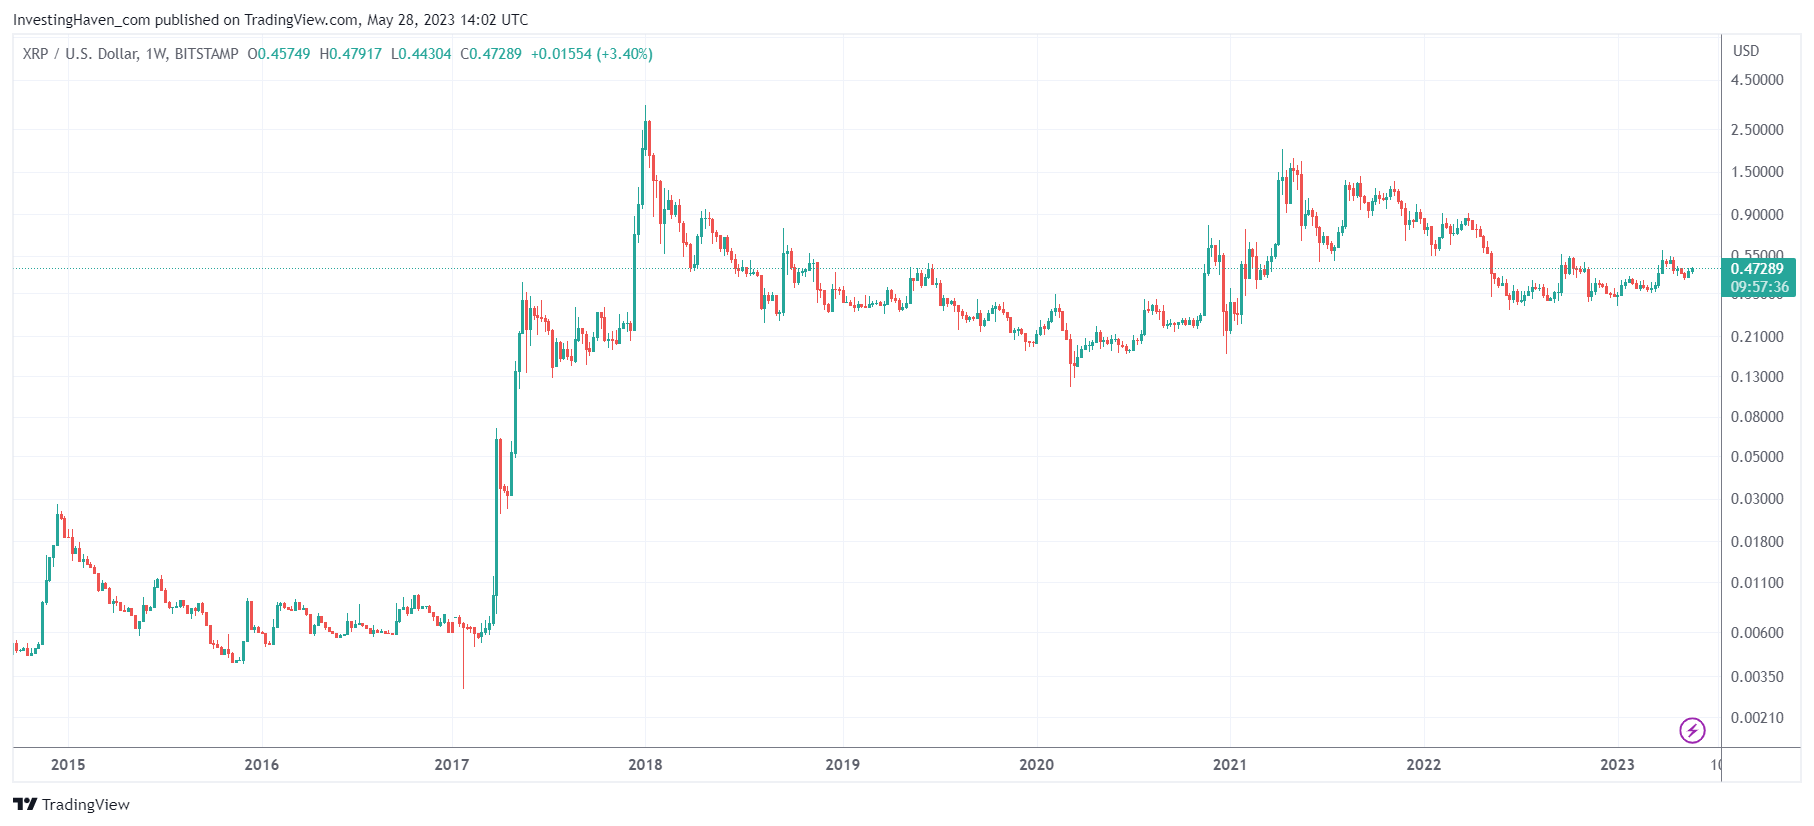
Commentary and 2 charts added on May 28th, 2023:
Below is the up to date weekly chart of XRP. It is getting stronger with each passing week. What we do like a lot about this setup:
- A series of higher lows in 2023.
- Volatility is declining which means selling pressure is fading.
- The giant W reversal since 2018 is taking more shape, it’s getting clearer and cleaner.
If we don’t factor in the Ripple/SEC lawsuit, we would see STRONG BUY and add IMMEDIATELY to this market call. There is no doubt on our mind that this setup is explosive, sooner or later it can erupt.
However, the SEC lawsuit remains a risk.
One way to think of this is to look at the bullish setup and conclude that the odds of a ‘Ripple victory’ (at least, no Ripple defeat) are increasing. In the end, charts don’t lie.
Even Forbes wrote about it: Ripple Effects From SEC Suit Could Strengthen Coinbase Litigation:
The SEC’s crackdown on crypto continues, with Chair Gary Gensler accusing the industry of suffering from “a lack of regulatory compliance, not a lack of regulatory clarity.” But in the agency’s bid to wrangle digital assets by classifying them as securities, it faces significant opposition from an unexpected source — the SEC of yesteryear.
Gensler recently claimed that all digital assets other than bitcoin could be considered securities and could therefore be subject to securities law. But haunting the agency in its legal campaign against crypto are past statements and internal documents that are likely to present a much different opinion. The SEC has tried to keep these documents under wraps in its lawsuit against Ripple Labs. But a federal judge ruled last week that they be made available to the public. The decision marks a big win for Ripple and potentially an even bigger win for the industry.
The last two sentences might make a big difference, a really big one!
As with any conflict, there won’t be a clear winner. But if the judge won’t call XRP a security, irrespective of what else she will conclude about Ripple (incl. potential penalties) it will unleash tremendous power on XRP’s price chart.
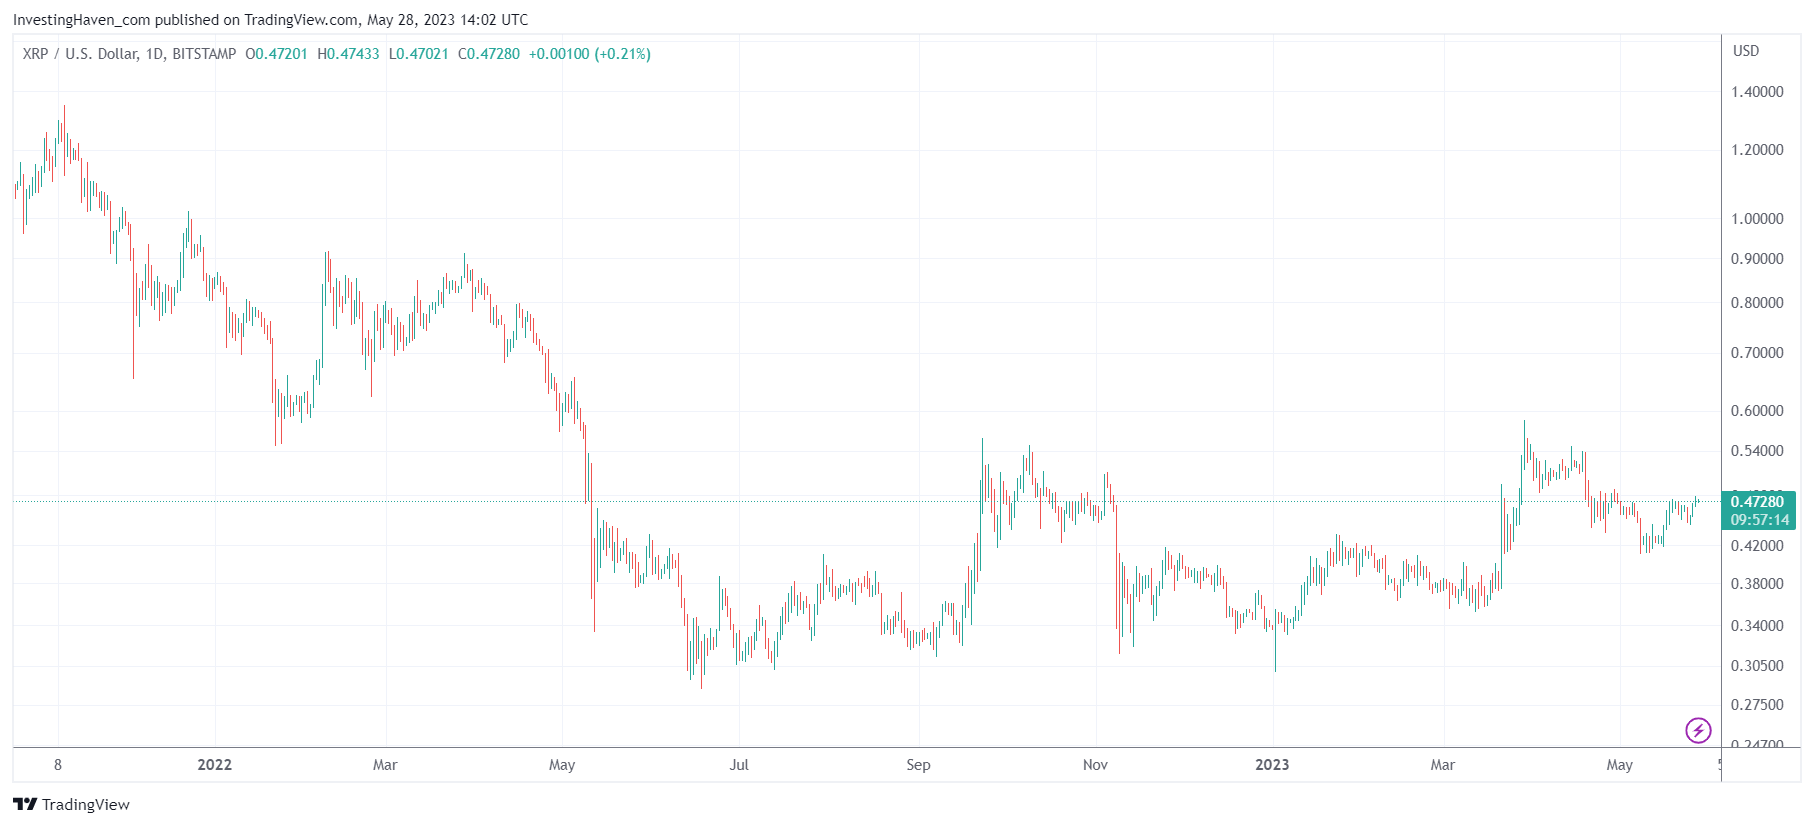
That said, the daily XRP chart (shorter time frame than the one above, essentially the right hand side of the W structure) is reflecting the build-up of bullish momentum.
XRP remains very controversial: among the strongest (if not THE strongest) long term crypto chart of 2023 combined with looming risk about the outcome of the SEC/Ripple lawsuit (which shows an increasing number of signs of a favorable resolution for crypto investors although this is in no way confirmed).
XRP charts with specific price points are shared frequently in our crypto investing research service >>