There is such bearish sentiment around cryptocurrencies that we believe it is time to become … BULLISH. Yes indeed, we do the opposite as what the masses do and think. At InvestingHaven we monitor hundreds, if not +1000, charts in the crypto space. Though there is one that really stands out, and we will share this one exceptionally today in the public domain. Readers may consider this a sneak preview of what premium subscribers receive with much more detail and with specific entry/exit ideas.
Before looking into the one chart that makes us incredibly bullish we want to continue on the contrarian thinking. Think back, for a minute, to the time period at the end of December last year. Literally everyone was bullish on cryptocurrency. Mainstream media started debating the possibility of Bitcoin going to $50k and higher. That is when we became bearish. On December 31st we recommended to become defensive, and take profits, in this article Ripple Rises 10-Fold In One Month. Cryptoccurencies Setting A Major Intermediate Top?
As the crash materialized a couple of weeks later we projected on January 27th 2018 this in an alert to the premium subscribers of our blockchain investing research service: “Our 2018 forecast is that we will see several months of consolidation around current levels because the recent ‘damage’ was significant. Somewhere around summer time, towards the second half of 2018, we expect another mega run. In case you bought high towards the end of last year you might want to wait until later this year to take some profits, and, in the meantime, you can consider adding to your positions in the coming weeks and months.”
Yes, we still strongly feel that this scenario is accurate as all our indicators, for the time being, point in this direction. Again, this is a forecast of January 2018, when the crypto crash started.
It pays off to be contrarian.
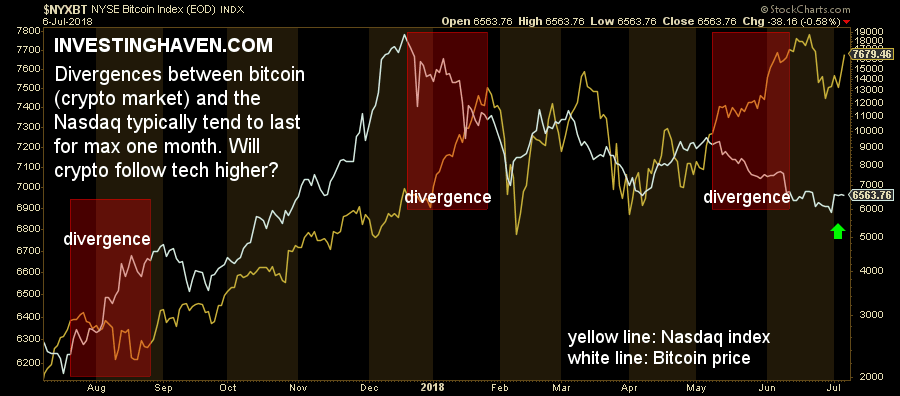
Right now, there is one chart particularly that makes us bullish, the one embedded below. It shows both the price of Bitcoin as well the prices of technology stocks represented by the NASDAQ index.
Why is this chart and the correlation between both assets so important? Because crypto tends to move in tandem with tech stocks, and because tech stocks go higher when markets are in a RISK ON environment … and so does the crypto market. So the circle is complete.
Note how the crypto market and tech stocks have diverged only a couple of months in the last year. Those divergences have lasted a month. Most likely, the latest divergence which the Bitcoin retracement pushing it to below $6k is over.
How exactly to play the crypto market, i.e. get the most profits out of it with the safest cryptocurrencies and blockchain stocks, is obviously reserved to premium subscribers of our blockchain investing service. They get the details on our 10 favorite cryptocurrencies and blockchain stocks, when to be defensive and when to buy aggressively. They also get weekly educational alerts.