
The most important global leading indicator for risk assets is the Euro. The way to think of it is that bullish or bearish trends on the Euro chart drive trends in risk assets like stocks and commodities. The Euro’s monthly closing price of April and May will be crucial, they might have a very special message to investors around the globe. Amusingly, financial media is not picking this message up because their timeframe is (way) too short.
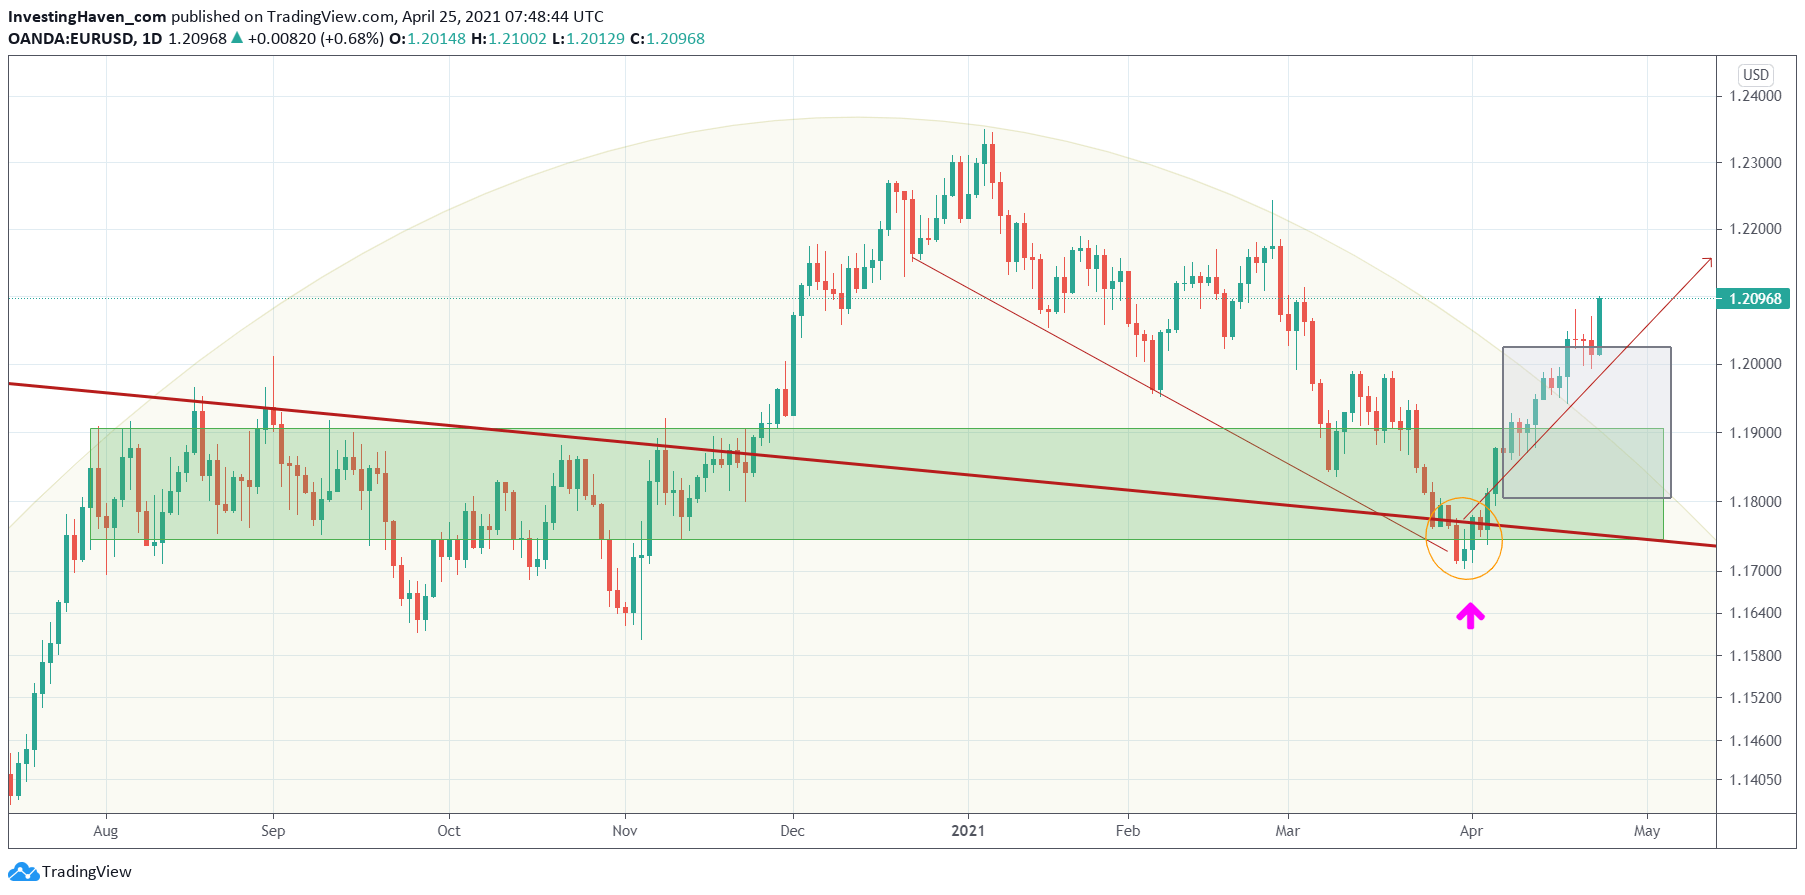
This is the daily Euro chart we featured a few times in recent months. This is what we wrote in our premium weekend update on April 11th to our Momentum Investing members:
Currently, the Euro has stopped falling, as seen on below chart. Once it rises above 1.195 points particularly in the next 3 to 4 weeks we can be sure that momentum sector will be able to prepare a new trend either before or during summer.
The Euro is looking strong here, and as said it is clearing 1.195 points which is very promising for stocks (high level trend for the rest of the year) but far more so for commodities.
 It really is the monthly Euro chart below that is absolutely impressive.
First of all, the Euro is now confirming a breakout after a 12 year downtrend! This is major, this is breaking news.
Anyone found any trace of this insight in financial media? Of course not. Their focus is on the short term, and also not on relevant insights that are critical to investors.
We see the last big green candle (April) which is about to get larger than the previous big red candle (March). This is a rejection scenario: the Euro refused to fall below the 12 year bear market trendline.
Second, look at the structure between 2014 and today. A giant W reversal. Hugely bullish!
Third, look at the purple arrow and pls scroll up again to see what happened on April 1st, 2021. Those 3 day candles that were printed below the red trendline recovered immediately and got back above the trendline. This is what we call a bullish micro reversal. And it happened at a 12 year trendline. Extremely important, this is, and critical for the long term trend. That’s how short term price info has predictive information about long term trends.
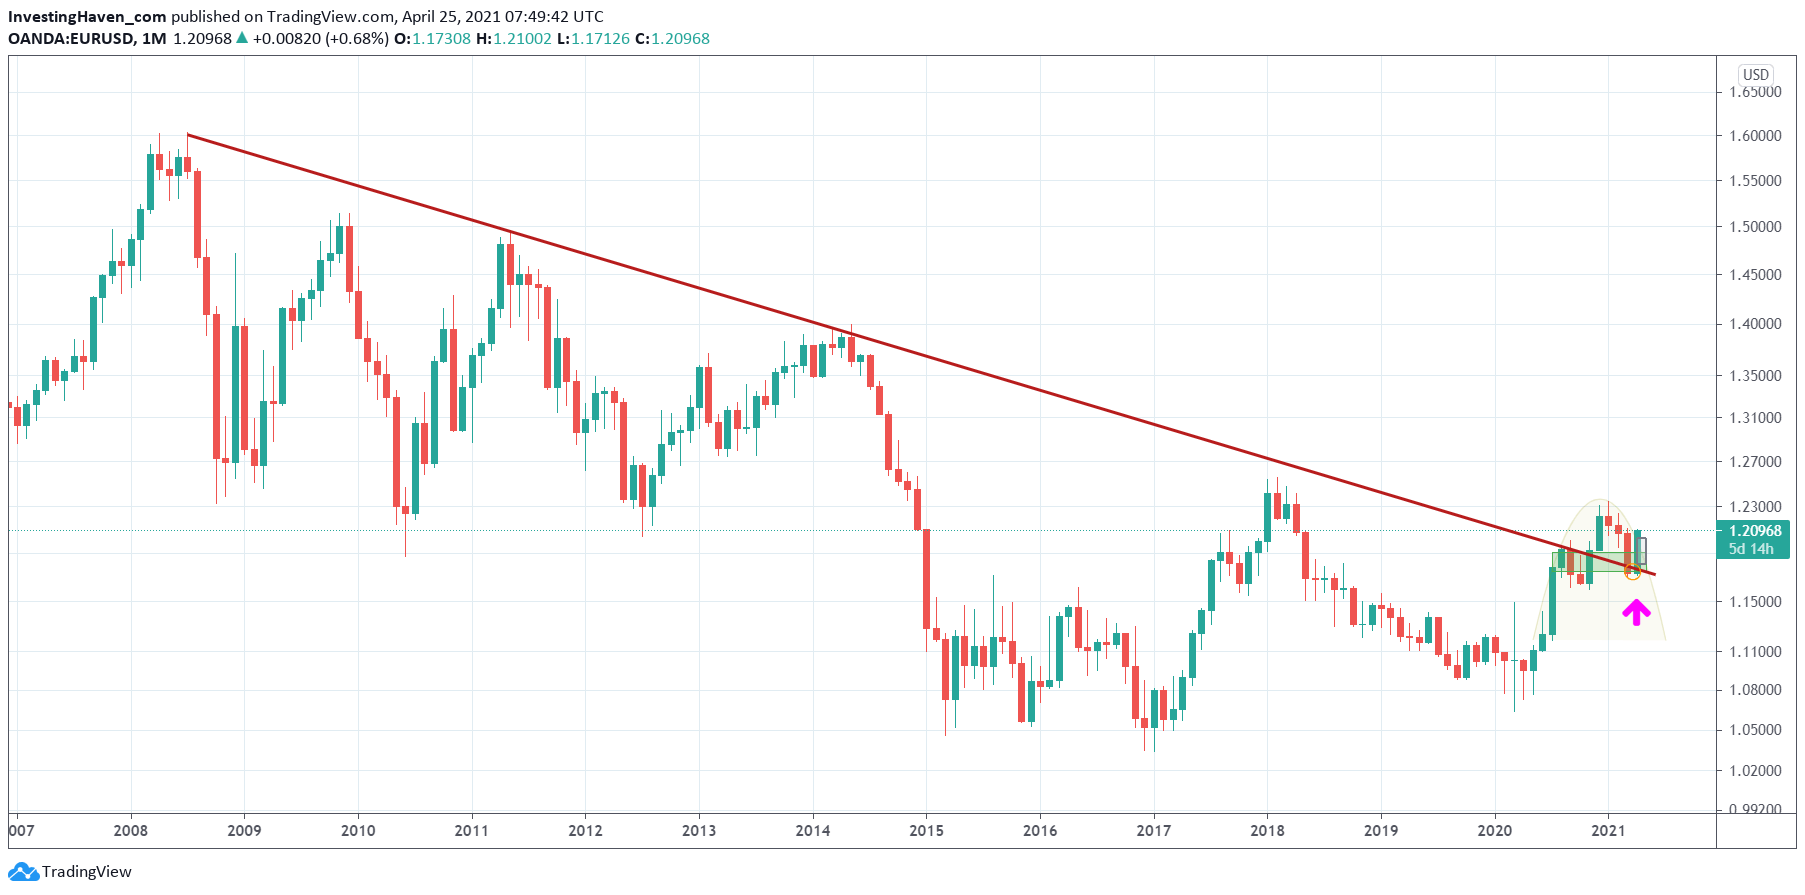
What the Euro charts tell us is that stocks in general, but primarily commodities will do well in the long run. Validation of this thesis: Euro must continue to close above 1.20 points in the next 3 to 5 months.
In our Trade Alerts portfolio as well as our Momentum Investing portfolio we took a short term trade and longer term investment in the gold and silver market. Moreover, in our Momentum Investing portfolio we are 100% invested in commodities! A very big bet on a few specific commodities segments, with the aim to more than double our portfolio value in 2021.


