At InvestingHaven we are constantly on the lookout for the most promising stock sectors. Several of our 5 Top Stocks And Forecasts are doing very well, and are moving to our price targets. Moreover, in our search to find the TOP 3 investing opportunities of 2019 we see that the market is well on track to hit mega returns on the sectors we forecasted a long time ago. In a top down approach we now focus in this article on sectors, and pick out one of the few sectors that have a gorgeous setup: the aerospace stock sector.
In order to identify profitable trends investors must take a top down approach. As per our 100 investing tips for long term investors:
A strict and disciplined way to identifying trends on charts is required. The most fundamental way to apply the ‘start with the chart’ principle is the top down approach: first study the monthly chart as it shows the ongoing dominant trends, then the weekly chart, only after this the daily chart. This is the right approach to understand trends. Only if and once patterns or opportunities on all 3 timeframes are in synch is it justified to do an investment. In other words the 3 timeframes have to confirm each other, not divergence.
InvestingHaven’s research team looks at thousands charts per month. That’s the volume that’s required to identify the juicy opportunities. One of the most attractive chart setups is visible in aerospace stocks.
We look at the monthly as well as the weekly charts to identify the trend in the aerospace stocks space.
This article only looks at the chart setup, not at fundamentals nor will we analyze aerospace news. We will also not look in specific names like Boeing which was tipped by Cohen on CNBC.
Aerospace Stocks: Long Term Charts & Trends
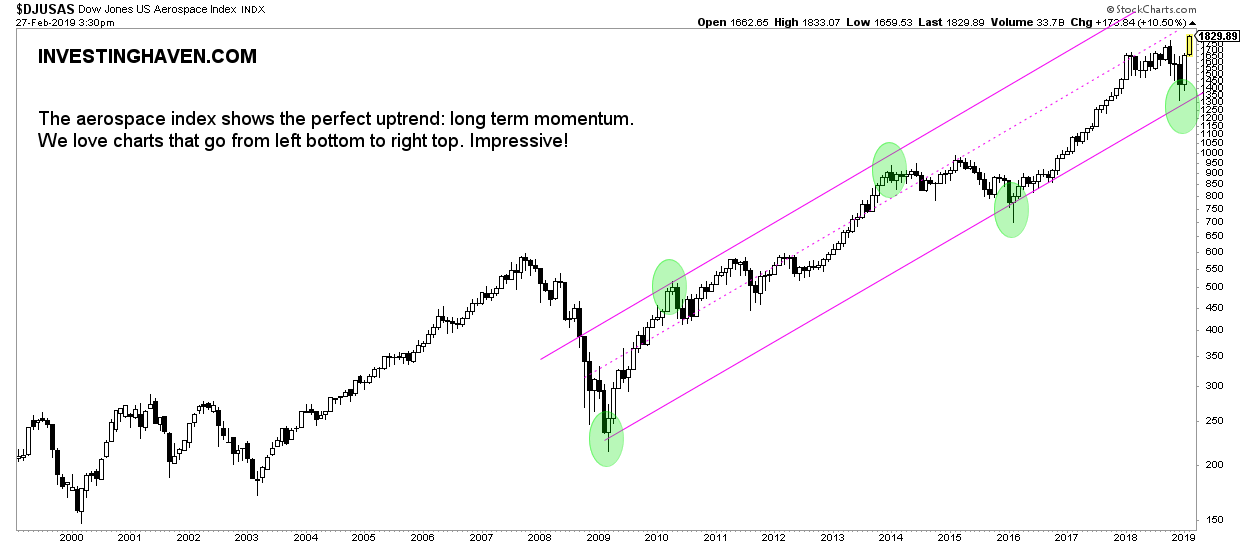
The monthly chart is gorgeous, really.
This is a beautiful long term momentum chart that goes from left bottom to right top. Since 2009, the aerospace stocks space is in a perfect uptrend in a long term rising channel.
The reliability of this channel is very high as seen on the number of touches. The likelihood of a continued uptrend is high.
Note that the resistance line was tested twice in the last 10 years while support was tested 3 times. Chances are high that a test of resistance will take place again. The condition though is that the median line will not impede this.
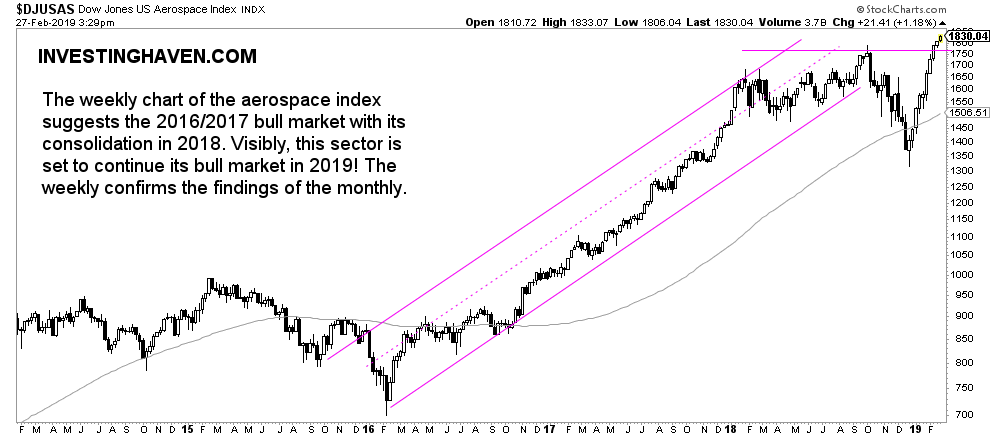
The weekly chart confirms the monthly long term trend. It just provides some more detail. This is a good thing, it makes the setup more reliable.
The weekly shows a strong uptrend in 2016/2017 followed by a consolidation in 2018.
2019 is set to continue the former bull market. Note the breakout that took place in Feb 2019. This is a bullish sign!
Investors that are looking for exposure in this sector should analyze the holdings in the aerospace stocks sector and identify the outperforming stocks. Alternatively, taking a position on the sector is a good option as well.