AI stocks have been in the spotlight for some time now, and after a stellar performance in January, they hit a roadblock in the markets. This was predicted by InvestingHaven in an article published on Feb 11th, 2023 Leading Indicators Confirming A Pullback Is Underway. Fast forward to today, broad markets look good, tech stocks look great, so then consequently AI stocks should come with an epic opportunity. In this post, we check the answer to that last question.
Before answering this last question, we have to go back to early February when markets were doing surprisingly well. We are turning short term bearish, early February, it was a contrarian call at that time. Remember, there was no sign of a banking crisis at that point in time.
As expected, the pullback pushed all markets lower, including AI stocks. However, in the 2nd week of March, the 2023 banking crisis started to look extremely scary, and a stock market crash seemed imminent. InvestingHaven was able to spot the trajectory of AI stocks before it happened. In an article published on February 12th, 2023, they described how AI stocks would behave during the pullback: Artificial Intelligence Stocks: First A Drop To Support, Then A Breakout Attempt.
Fast forward to today, AI stocks are coming to life again, and sector ETF BOTZ is working on a bullish reversal.
The first chart embedded below is the daily chart of the Global X Robotics & Artificial Intelligence ETF (BOTZ). The chart shows that BOTZ has been in a downtrend since November of 2021.
The characteristics of this reversal suggest that it is a very powerful reversal. The chart analysis of BOTZ ETF shows a rounded pattern that is about to complete, indicating a strong bullish reversal. The rounded pattern that has formed on the chart is a classic technical pattern that often precedes a trend reversal. The rounded pattern is marked by a gradual rounding of the price action, followed by a breakout above the prior resistance level. If the pattern is completed, it suggests that BOTZ is likely to move higher in the coming weeks and months.
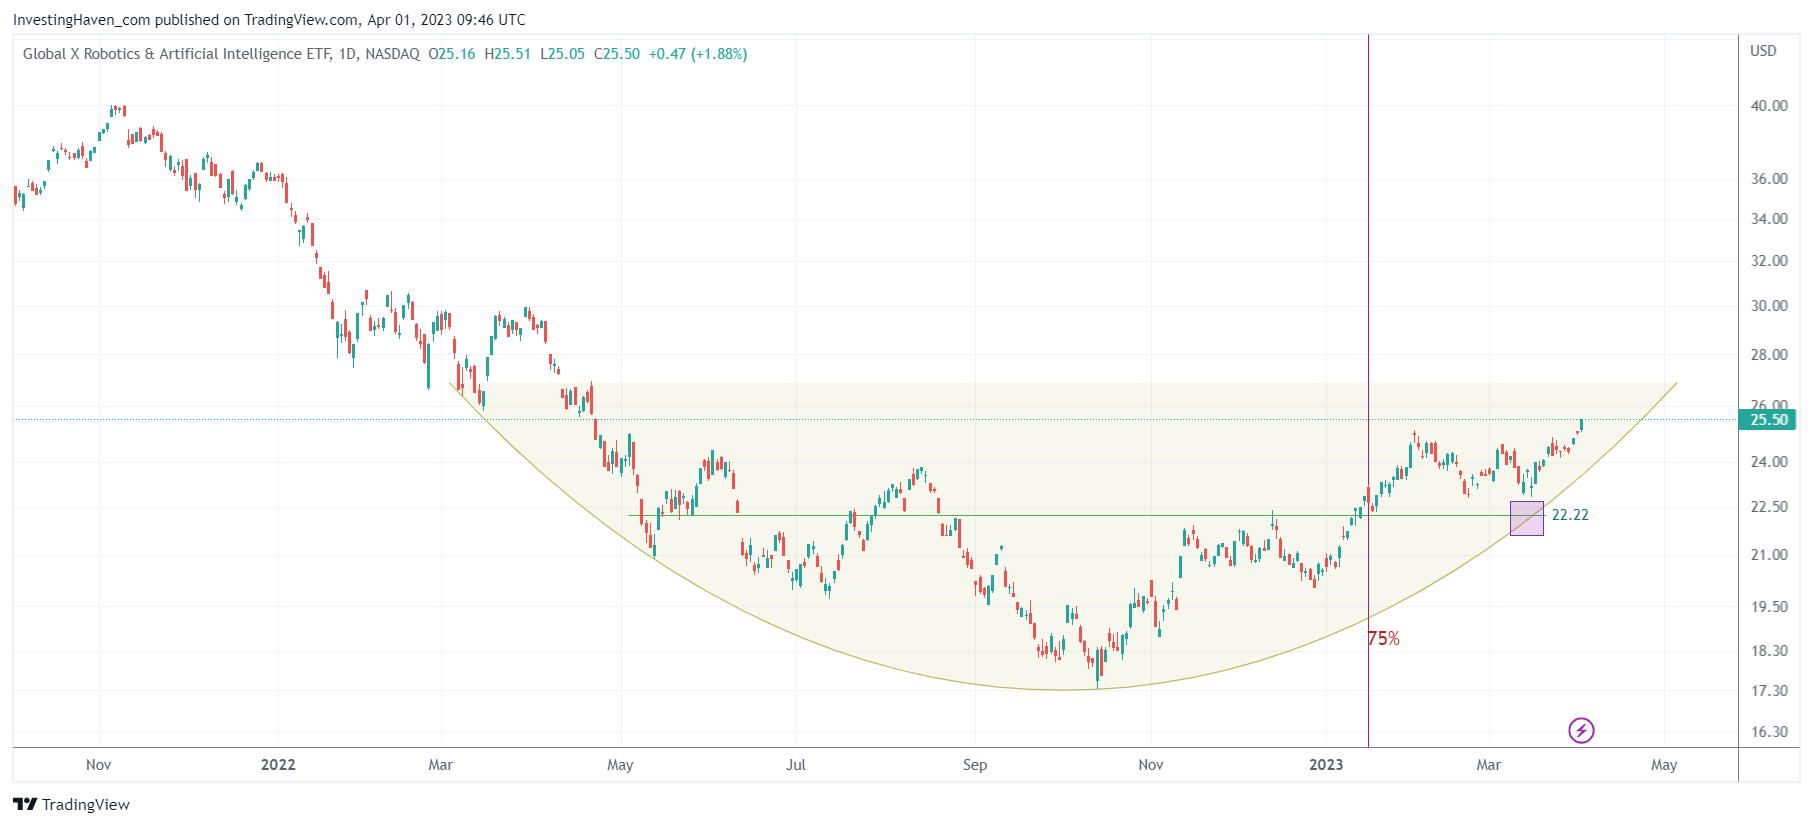
Here is the catch, looking at the BOTZ ETF, the chart shown above. We look at the chart and apply our chart analysis to this. We look at the price axis, time axis, combine both and derive actionable conclusions. More importantly, we are able to spot, in real time, turning points and make predictions about the intensity of the new trend before it happens.
However, if you look at this chart, purely from a technical analysis perspective (not to be confused with chart analysis), you would end up with the following ‘observations’:
The MACD (Moving Average Convergence Divergence) indicator is still bearish, but it is starting to flatten out, indicating that the momentum of the downtrend is slowing down. Overall, while the trend is currently bearish, the rounded pattern and positive RSI divergence suggest that a bullish reversal may be in the works for BOTZ in the near future.
You can now see how chart analysis is different from technical analysis.
The same applies to one of the few pure play AI stocks, also one that is listed in BOTZ ETF. Below is the chart of C3.ai (symbol AI).
Based on InvestingHaven’s forecasting methodology, their premium Momentum Investing members were able to go long right at the green arrow, right above 21 USD, at the depth of the banking crisis. This chart is now extremely powerful and one of the leaders of the AI sector, further solidifying the bullish sentiment.
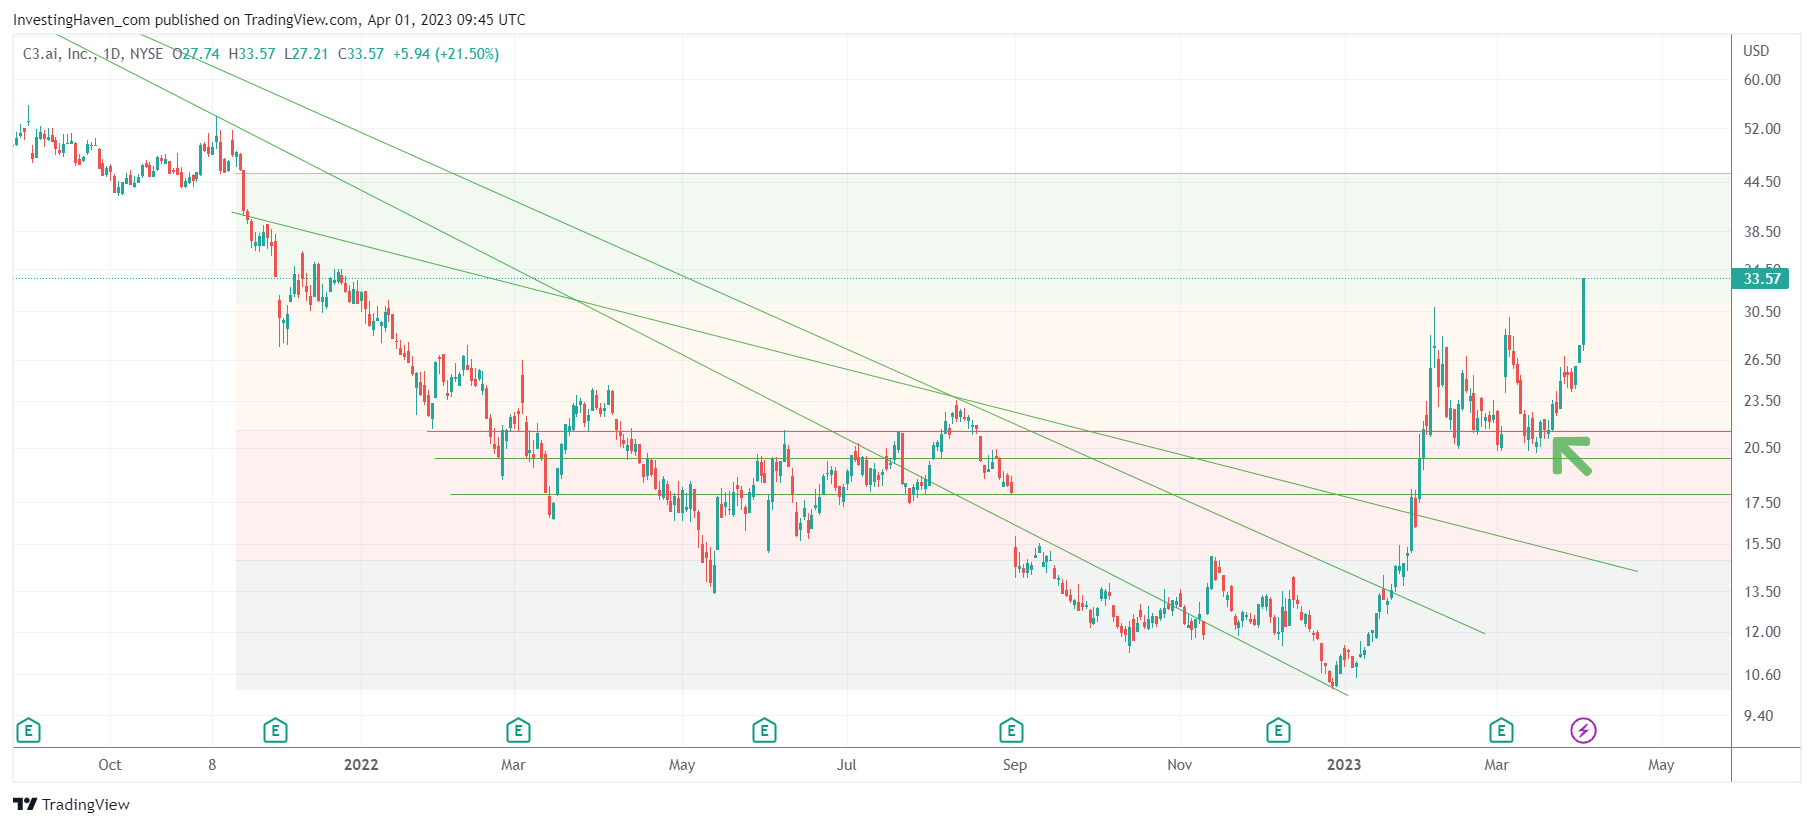
Not one technical analyst would be buying at 21 USD, simply because the trend was not positive at that point in time. Lagging indicators, which are the basis of technical analysis, think of moving averages and MACD or RSI indicators, would not be flashing a buy signal where we initiated a position.
Again, at InvestingHaven we apply chart analysis, not to be confused with technical analysis. It’s not a big difference, it’s a huge difference!
Take, for instance, the warnings that were issued by officials and financial media, in the week of March 13th, at the depth of the banking crisis. This is one of the many illustrations: IMF chief warns global financial stability at risk from banking turmoil.
This is what we were writing at InvestingHaven in that same week: Markets Downside Target Reached – What Now:
It’s really very simple: this current level must hold in order to qualify as a bullish reversal. In fact, IF this level holds, it will confirm the rounded pattern which is a bullish pattern that has a bullish outcome.
It’s during that week that we initiated the position in AI, one that has 50% unrealized profits after Friday’s close.
In conclusion, AI stocks are working on a very strong bullish reversal, as evidenced by the Sector ETF BOTZ and C3.ai. Investors who are looking to capitalize on this trend should keep a close eye on the charts and consider investing in the AI sector.


