AMD shares rose 8.5 pct on Thursday and 19.7 pct this week. Obviously there was good news around AMD. AMD confirms now our bullish forecast. Regardless, as per our 1/99 Investing Principles, we do not care to much about news but remain focused on a couple of price points on AMD’s chart. Depending on a breakout above all-time highs AMD may become ultra-bullish in which case it will deserve a spot in our top 3 tech stocks for 2019.
This article will focus only on the chart setup of AMD, not the financial news of AMD.
According to our 100 investing tips investors need a strict and disciplined way to identify trends on charts. The most fundamental way to apply the ‘start with the chart’ principle is the top down approach: first study the monthly chart as it shows the ongoing dominant trends, then the weekly chart, only after this the daily chart. This is the right approach to understand trends. Only if and once patterns or opportunities on all 3 timeframes are in synch is it justified to do an investment. In other words the 3 timeframes have to confirm each other, not divergence.
The most fundamental way to apply the ‘start with the chart’ principle is the top down approach: first study the monthly chart as it shows the ongoing dominant trends, then the weekly chart, only after this the daily chart. This is the right approach to understand trends. Only if and once patterns or opportunities on all 3 timeframes are in synch is it justified to do an investment. In other words the 3 timeframes have to confirm each other, not divergence.
That’s we only focus on the 3 key timeframes in this article.
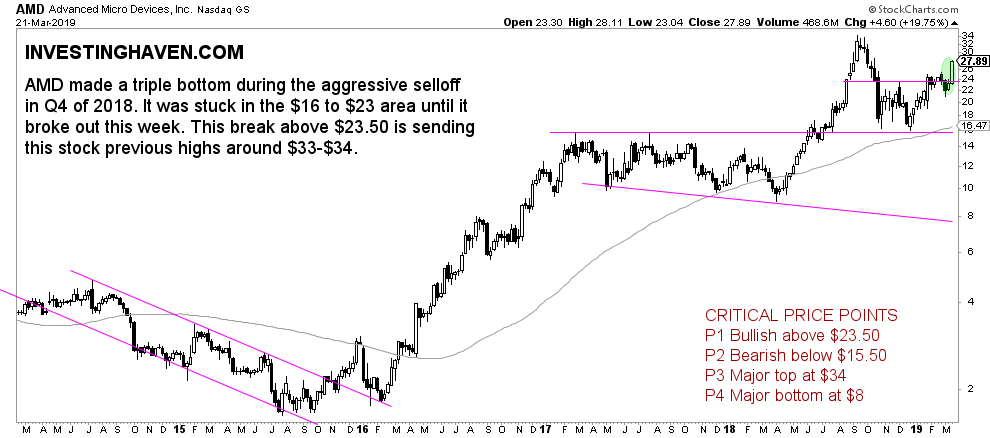
As said previously for AMD in 2019 we see the following critical price points:
- P1 Bullish above $23.50
- P2 Bearish below $15.50
- P3 Major top at $34
- P4 Major bottom at $8
The daily chart shows a breakout. This is very bullish.
However, looking just at the daily timeframe does not the story because there may be (much more) dominant trends on the higher timeframes. We are looking for confirmation on the weekly and monthly.
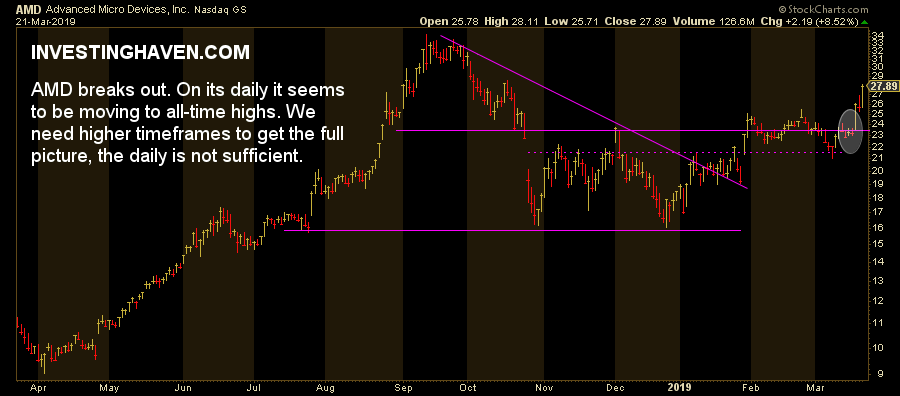
The weekly shows no new information and certainly no other dominant trends. A move to previous highs set in 2018 is where AMD is moving towards.
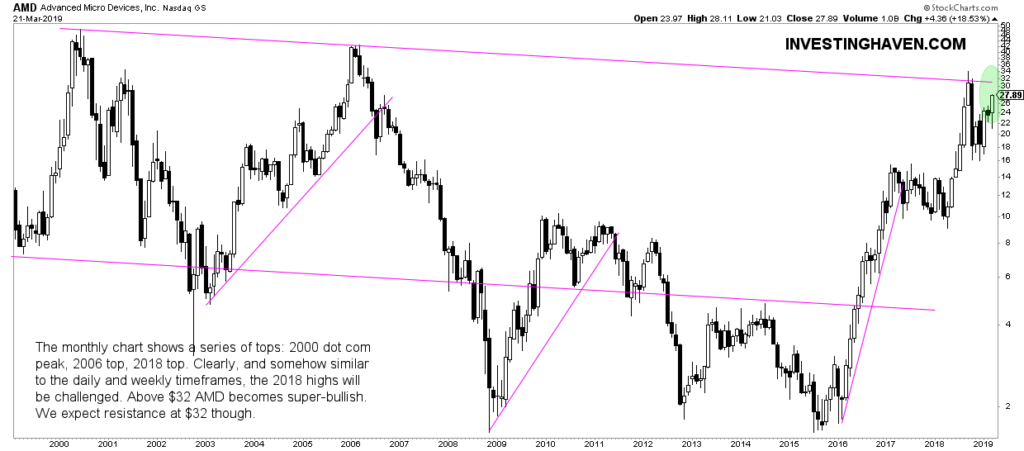
The monthly has a setup that reveals some more insights. The 2000 dotcom peak combined with the 2006 highs set a clear trend which connects with the 2018 highs.
In other words, coincidentally, the trendline on the monthly coincides with the 2018 highs. So the monthly confirms the weekly and daily that AMD is moving to 32.50 USD. That’s an almost guaranteed rise of 16 pct.
The key point is this though: a break above this long term rising channel, above 32.50 USD, would turn AMD super-bullish. That will be at a market cap of $29B. In that scenario we expect AMD to rise much higher.