Our historical Canada stock market chart published 7 months ago featured the long term TSX chart. It identified a breakout attempt near all-time highs. In the meantime the strong correction slashed this index with some 20 pct. As 2019 kicks off, with a global market crash looming, is the Canadian Stock Exchange (TSX) a buy or a sell?
The conclusion from our previous chart analysis was that the TSX was attempting to break through all-time highs:
One of the most important observations on this chart is the 3 attempts to break out as indicated with the 3 small red circles. One in 2008, one in 2017 and one in 2018. Will this time be different? That may be the case, and smart investors closely watch what happens in July of 2018. If the TSX index, representing Canada’s stock market, closes above 16277 points, and does so in August as well, it will be hugely bullish.
The breakout never materialized. Consequently, a strong move in the opposite direction started.
What does the TSX suggest for 2019? Is the TSX index a buy or a sell?
We only look at the chart setup in this article, not at fundamentals nor intermarket dynamics. Nor are we interested in the Canadian stock market news.
This article has only one objective: justify a long or short position, and discover buy or sell price points.
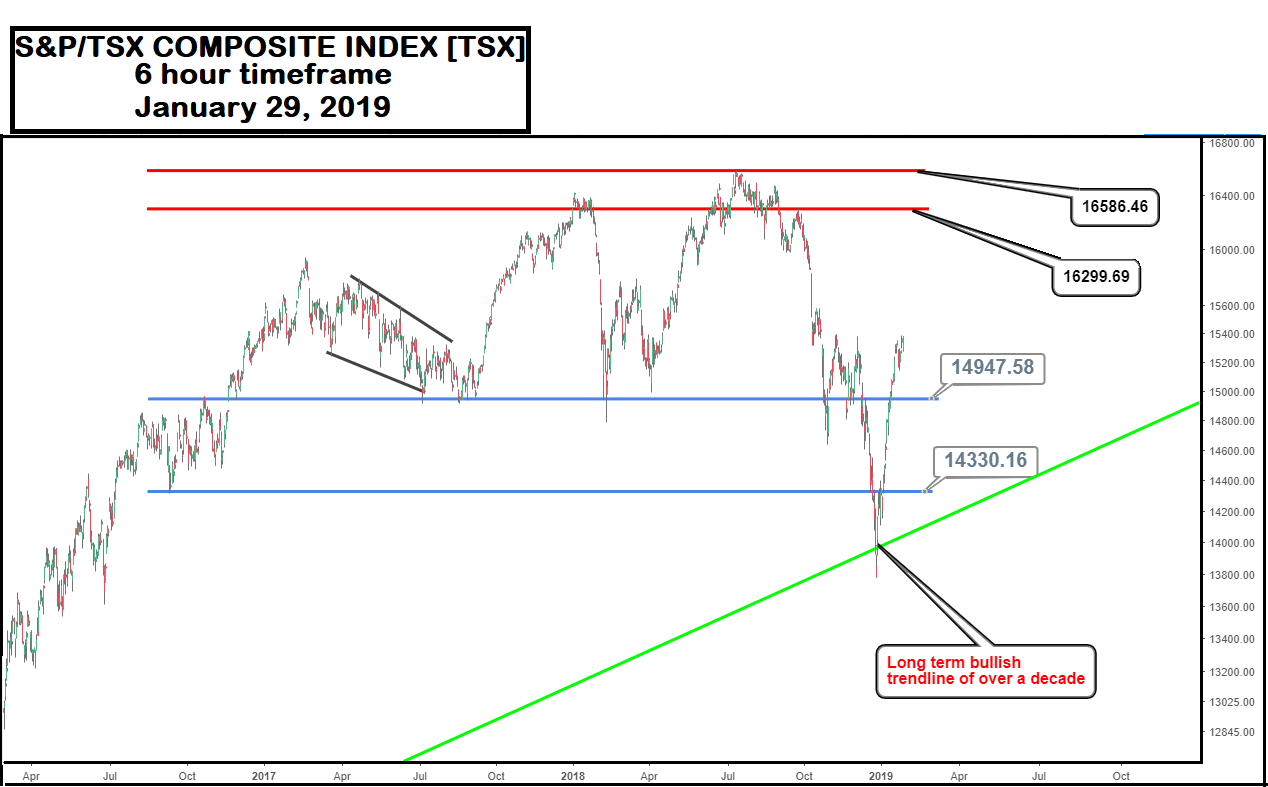
Price action closed on December 24, 2018 below major support between 14,947.58 and 14,330.16. Moreover same close on December 24, 2018 saw price action close below its bullish trendline that has lasted over a decade.
Both scenarios above do call for a huge caution and/or warning for the current uptrend in the TSX. The market condition for the TSX in this case is therefore a downtrend to a side trend at best.
Resistance or overhead supply lies between 16,586.46 and 16,299.69.
The sideways market condition for the TSX considered in this analysis is better referred to as a rectangle top formation (tentative) that exists mainly between the upper boundary of support i.e. 16,586.46 and lower boundary of resistance i.e. 16,299.69.
Price breaking out above the high made on July 13, 2018 of 16,586.46 marks the resumption of the uptrend in the TSX.
Ed. note: this is a sneak preview of a trade alert service we are developing for you. It will feature very precise entry and exit points. Moreover, it will do a risk calculation to understand whether the timing justifies taking positions. More to come, stay tuned.