We can’t emphasize enough the importance of the Euro. It IS the leading indicator for global markets as explained in our investing methodology as well as our 15 leading indicators section. The Euro chart now starts showing signs of turning bullish. Make no mistake, this may have major bullish implications for stock markets that are struggling for 18 months to exceed new all-time highs. “It” may be starting now is what the Euro chart says.
A few months ago we gave the background to understand the Euro and its role in our intermarket analysis. As per this article Leading Indicator: The Message Of The Euro:
When combining chart analysis with intermarket analysis we get a very powerful combination. It helps understand to which assets capital is flowing.
In doing so we combine two crucially important investing principles. The first one:
The art of understanding intermarket dynamics is the combination of 3 things: identifying leading assets + reading charts of those assets and respecting chart characteristics of each asset separately + identifying major turning point for each asset. Once this is in place it becomes obvious which asset has a primary or dominant force influencing other assets. This is what we derive from intermarket dynamics, and this is the key to forecast markets.
Moreover, and further to the previous principle:
All major moves in markets, especially market crashes, start with major turning points in credit and currency markets. That’s why 10 and 20 year rates, as well as leading currency pairs, have the most influence on all other markets, including stock markets around the globe.
In other words we have to check currency and credit markets first, understand where they are in their dominant trend(s), and hold this against other asset classes and markets.
Euro turning bullish
All that said what we now see happening in the Euro may be pivotal.
Let’s look at the Euro in a typical top-down approach.
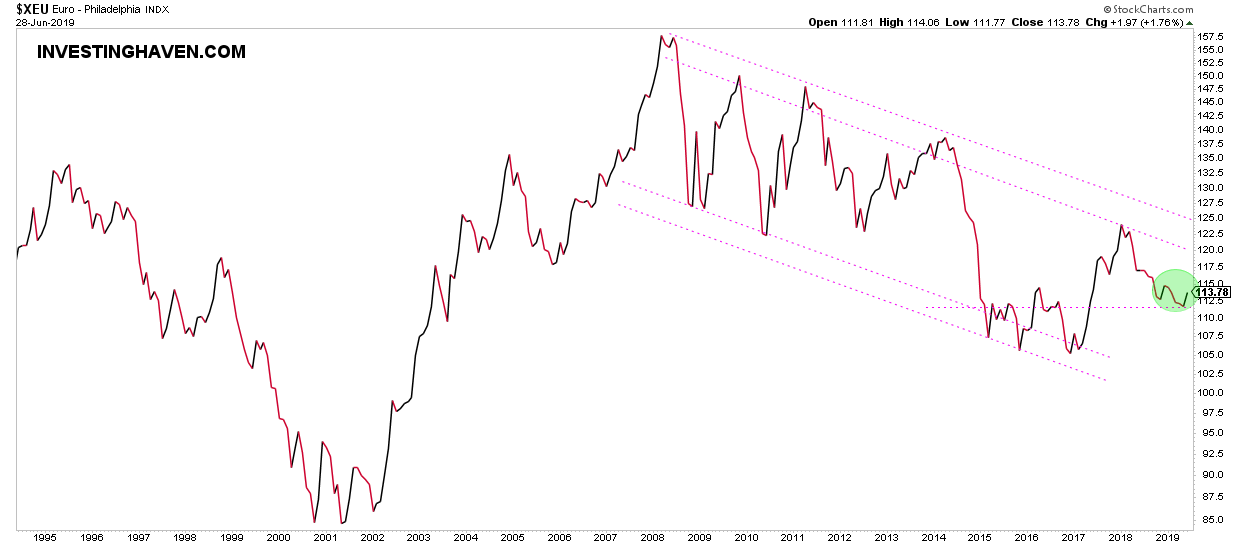
First the monthly chart shows signs of the end of the ongoing downtrend that started in 2009.
We start seeing signs of a (tactical) triangle which is bullish in nature in the context of the (secular) downtrend.
So this is the start of a tactical bullish trend which typically can last between 6 to 18 months. But this is important because it may unleash lots of energy in other markets elsewhere, like global stocks and/or commodities. It may also set the stage for a secular trend change, but that’s too far out in the future so we should speculate on that type of scenario at this point in time!
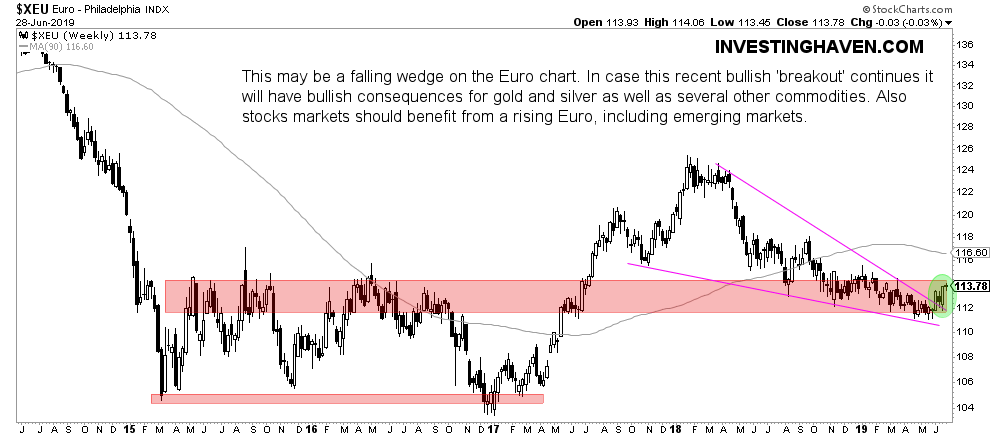
The weekly chart shows more detail on what’s going on, and it should be read after the monthly chart.
We see this falling wedge pattern (purple triangle) which stalled at horizontal support (red bar). This is a typical pattern for complex assets like currencies and commodities: two patterns combined determine future direction. Stocks are easier to read because they mostly are dominated by one pattern.
The Euro is now trading *exactly* at a pivotal point. It did already break out of the falling wedge (triangle) pattern, but did not bounce yet from its horizontal support. It may happen now, and if it happens it will be crucial as it will set the stage to show a bullish turn on the monthly chart shown above as well.
As said, this will unleash major bullish energy in global risk markets, especially stocks and potentially commodities!