In today’s article Global Markets Again At Make-or-Break Level we looked at the leading indicator of global markets: Treasuries and especially the Euro. In this article we look at global stock markets, and show on their chart how they arrived at a crucial price level as well. No coincidence, of course, that all leading indicators are simultaneously at crucial price levels. This is exactly how intermarket trends work, and this is in line with our investing methodology.
The one chart representing global stock markets is the Global Dow Index, symbol GDOW.
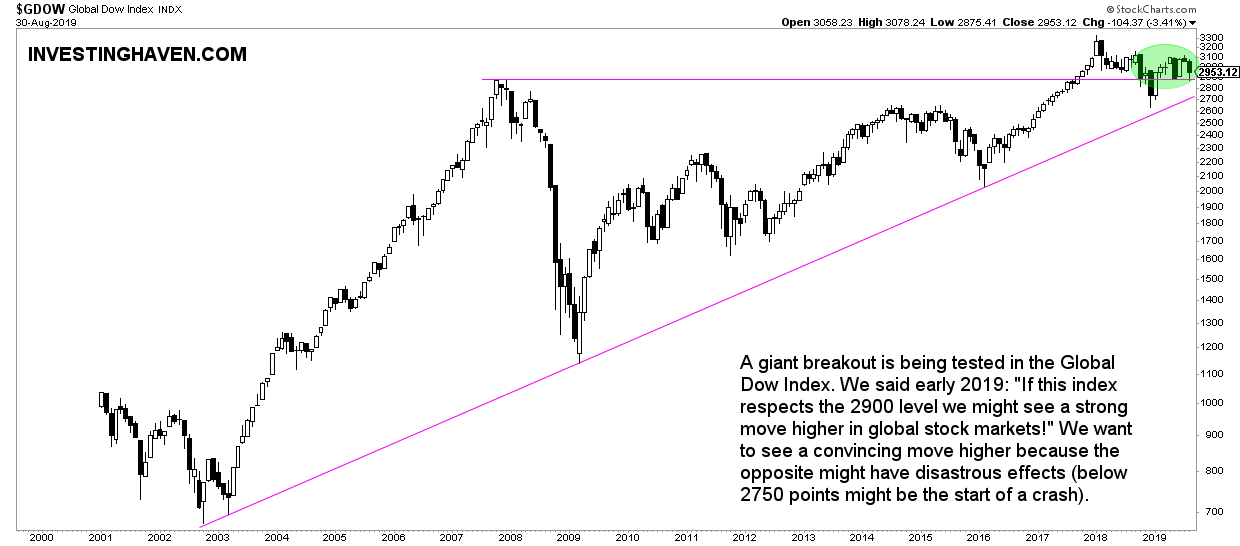
Below is the long term chart on 20 years. That’s the timeframe we need to identify secular trends, and more importantly major trend changes.
The one and only observation on this chart is the January 2018 breakout which is still in the process of being confirmed. Stated differently, global stock markets are trying for 19 full months now to become bullish but still did not succeed in it.
Interestingly, this breakout level which comes in at 2900 points on the GDOW is also the high of 2007. After 12 years the GDOW went through an epic stock market crash (2008/2009), fully recovered from it only to stabilize right below all-time highs.
It goes without saying that the importance of this chart pattern should not be underestimated, on the contrary! Any sustained break below the 2900 level, which means 3 consecutive monthly closes below it, will not be simply concerning but much worse than that!
In fact if the GDOW closes below 2900 points it will be close to the ‘other’ support line, the rising support line, near 2725 points.
Let’s be very clear here: any break below the 2725 points level will probably have a catastrophic effect! Nobody wants to see this.
Why do we believe this situation will resolve to the upside? Because it is every 2nd bear market that sets lower lows. We saw it in 2016, the previous bear market. The odds favor a sideways-alike bear market in 2018/2019. But as always we want to the data points to confirm our theory!
Ed. note: We provide in-depth analysis to our ‘free newsletter’ subscribers. We bring premium content with specific investing tips on a weekly basis, mid-week, free of charge. We do this for 4 months. Subscribe to our free newsletter and get premium investing insights in 2019 for free.