Gold and silver stocks break out from their 8 year downtrend. This comes with gold entering a new bull market and the silver price breakout on June 20th, 2019. One might argue that there is no confirmation yet as we mostly need 3 to 5 consecutive closes combined with 3 consecutive weekly closes above the breakout. We argue that the violence with this these breakouts took place this week, across all gold and silver and precious metals miners is already sufficient evidence in and on itself. That’s why we are convinced that this is the trigger for our gold forecast (GOLD) and silver forecast to materialize in 2019!
Gold and Silver Stocks Breakout Of 2019 Is Different
Here is one of the crucially important insights for investors, as per our investing tips for successful investing.
As explained in the intermarket dynamics section the temporary trades are caused by capital flows between asset classes and markets. This results in temporary cycles in markets. They typically last between 6 and 18 months. The key is to identify those market cycles, but also understand that they are subject to change.
Because capital flows from one asset class to other asset classes it tends to create powerful trends as soon as there is critical mass.
That’s exactly what’s happening in the gold market right now!
Sufficient capital came out of other asset classes, think of the U.S. Dollar and likely some stock market sectors. There was sufficient volume to push and exceed the giant resistance areas that were established during 8 years. The outcome is a new trend, and that has explosive potential.
So what we read in the gold price and silver price chart (which we posted on Thursday) as well as the precious metals stock charts embedded below is intermarket effects: critical mass capital has entered the gold and silver space.
That’s it, the rest will happen automatically as the large group of investors will follow with financial + social media paying attention going forward. Suddenly, there is much more headlines on gold and silver stocks while a few weeks ago there was hardly any news.
Unfortunately, the majority of investors will arrive late to the party, but that’s how markets work and how the psyche of investors work.
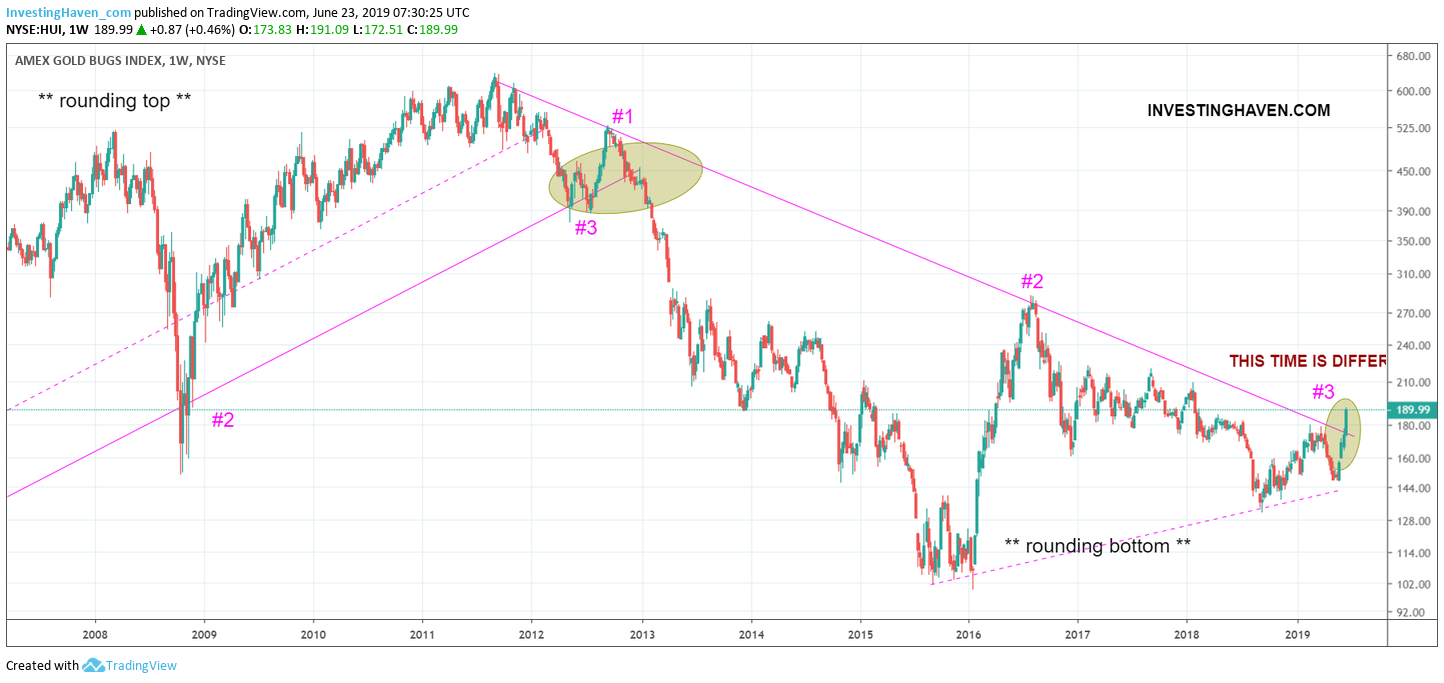
Gold and Silver Stocks Chart (12 year)
The gold and silver stocks chart below (HUI index) shows that the 3d breakout attempt in the context of the 8 year bear market proved to be strong enough. This is a breakout with lots of bullish energy, for sure compared to the previous attempts.
What’s a price target for gold and silver stocks? That’s not visible on this chart. We need a different view with the start of a new rising channel in order to calculate a price target. This is something we will post in the next few weeks.
Anyways, we have published our favorites a while ago, and we stick to it:
A First Majestic Silver Stock Forecast for 2019
Royal Gold: Giant Breakout Out Of 15-Year Bullish Pattern
Buy and hold, and start working on your exit plan as soon as we have the final confirmation of this breakout in 3 weeks from now.