The pullback in markets which we forecasted several weeks ago is happening as expected. We now have a breakdown on the NYSE index chart. How concerning is this?
The NYSE index chart shows a breakdown.
This comes after we got great sentiment readings, about a month ago, when we wrote Sentiment Readings Confirm This Nascent Bull Market:
Last summer we observed that the BBR was as bearish as it was during the tail end of the Great Financial Crisis in early 2009. During last year’s bear market, the BBR fell below 1.0 numerous times. We noted that such readings have a history of providing excellent buy signals for contrarian investors. In recent weeks, the BBR has risen above 1.00 to 1.73 during the January 31 week. That’s consistent with early bull market readings.
However, those were contrarian readings, not a characteristic of a bull market ‘in full force’ but rather a new bull market that only a majority is ‘seeing’.
Amid improving sentiment readings we also said that a tactical sell-off was underway. We wrote about it in the public domain, particularly in Leading Indicators Confirming A Pullback Is Underway:
Our chart reading suggests that the market will move lower unless and until the downtrend on this volatility index is broken to the downside.
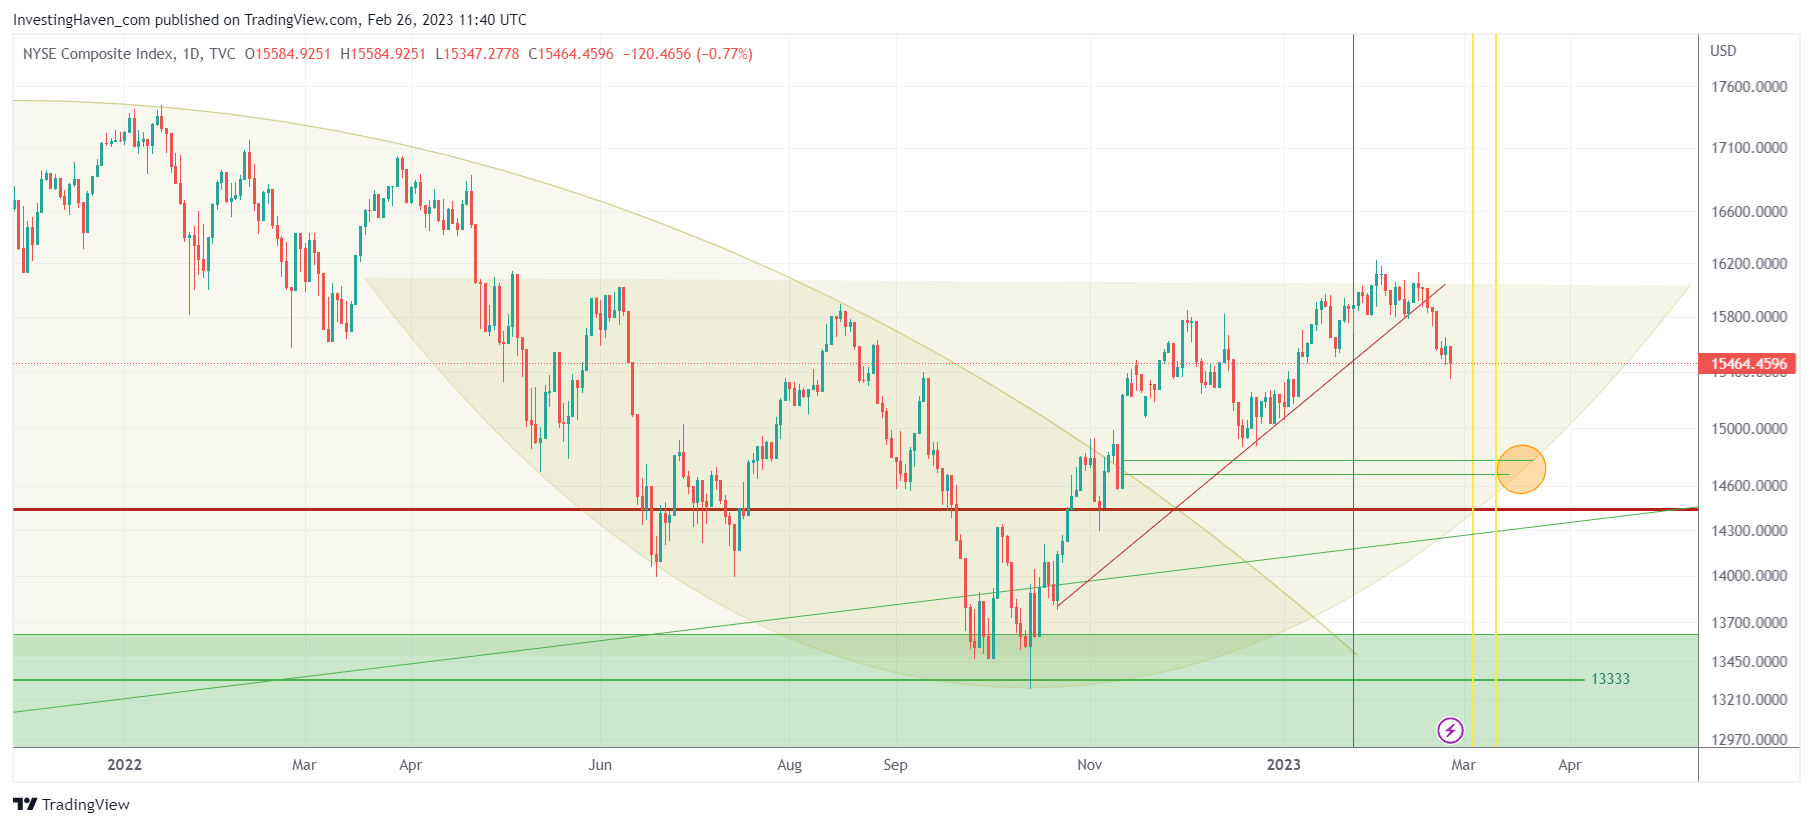
What we see now, on the NYSE chart shown below, is a breakdown of the rising trendline that originates from the October lows. If you would ‘strip out’ our annotations on the chart, and only ‘see’ the trendline breakdown, you would get concerned, rightfully so.
However, the pictures changes when considering what we wrote several weeks ago in A Reasonable NYSE Target For March of 2023:
The small orange circle on the chart is the price point that we believe will be tested. In terms of timing, somewhere in the first week of March is this price point coinciding with the rounded pattern. Whenever two dominant patterns or trendlines coincide, you better mark that day in your calendar. Our expectation is that a pullback to 14700-14900 is a real possibility, in the next 2 to 4 weeks from now. We believe it will be a ‘buy the dip’ opportunity.
Indeed, it looks like our forecasted price target is now underway, it is going to take a little longer is what we start concluding. We need another 3 weeks to get there, the price target remains valid.
IF the NYSE index will find support right at the orange circle on our chart, it would confirm the bullish rounded pattern. This means that it will be an EPIC buy the dip opportunity.
In our Momentum Investing service, we are preparing a shortlist of stocks that we want to buy on the dip, with particular focus on the AI & Big Data space. In case you are fed up with choppy markets and the the never-ending stream of doomsday headlines, you may want to consider having our algorithm do the hard work for you by auto-trading the S&P 500 >>