Once upon time, just 3 weeks ago, literally the entire investing community was bearish on the Nasdaq. That’s when we said to watch one specific chart to understand if the Nasdaq was a sell vs. buy opportunity. Today, more than one month later, it is clear that our chart reading and Nasdaq forecasting was spot-on. This is what we wrote in our Trade Alerts weekend alert on February 26th:
The one market that is pulling everything down is the Nasdaq. So we want to focus on the volatility index of the Nasdaq to understand more about selling (selling strength but also when/where it could end).
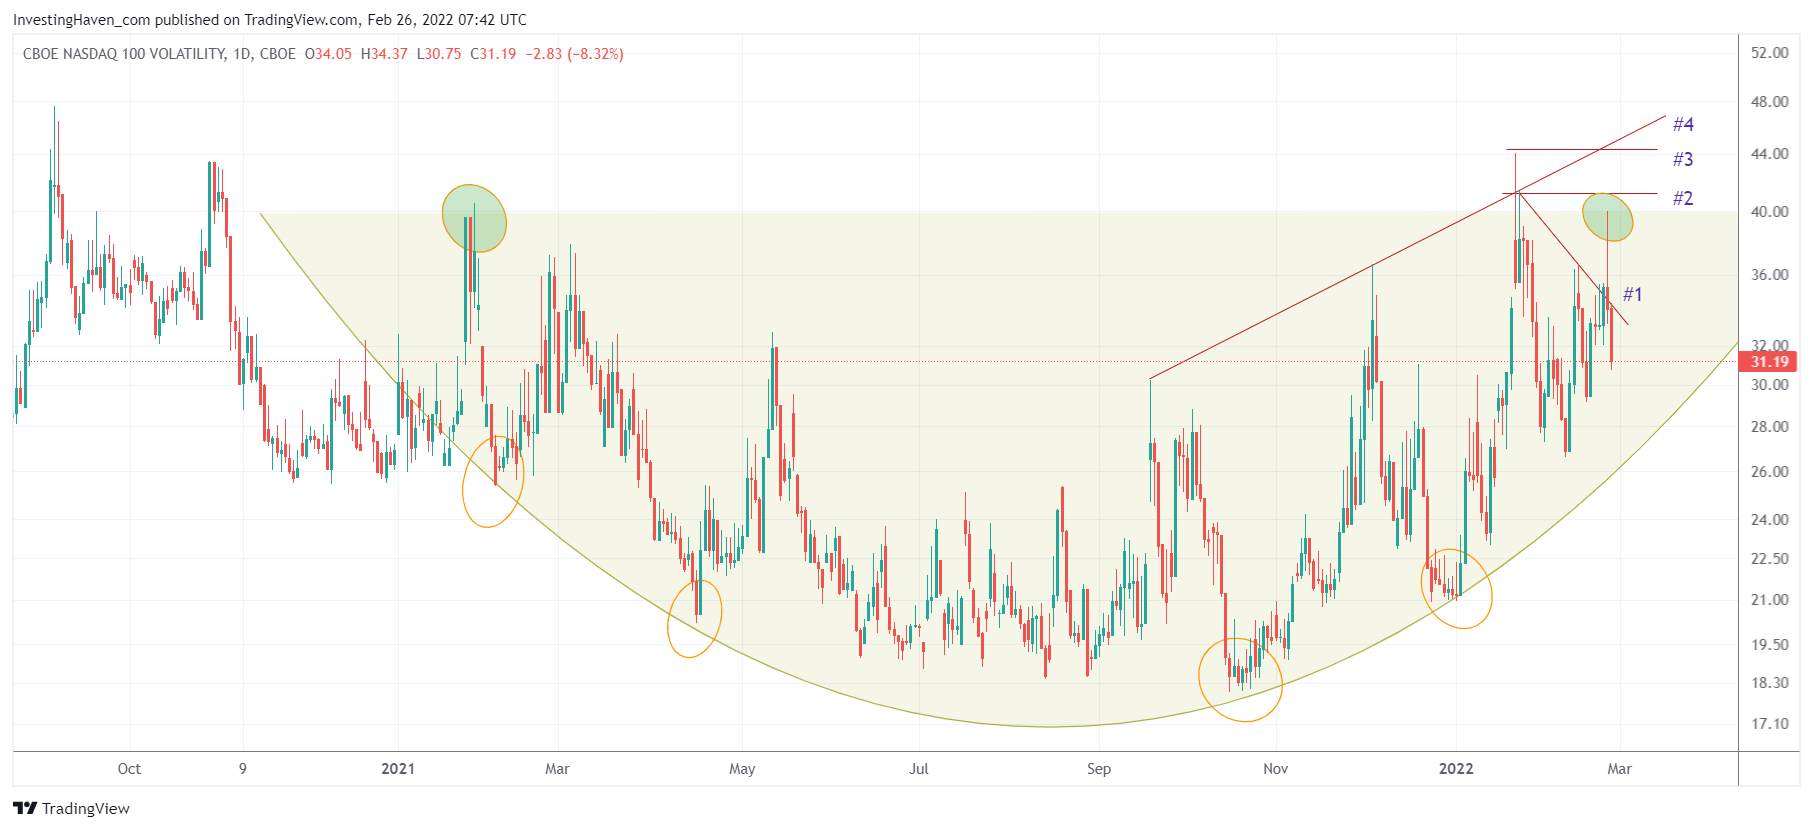
The long term setup of this volatility index will remain aggressive as long as (a) it continues to print higher lows (b) it continues to print higher highs.
As this index is in an uptrend we want to carefully observe where the next high will be printed, next week or the week after. We see four scenarios (please check the chart for corresponding numbers):
- If selling ends at #1 it will be very, very bullish for stocks. We would have a lower high in volatiliy, really good. But don’t count on it, there is no reason to believe that selling came to an end yesterday.
- If selling ends at #2 it will be simply bullish for stocks. No higher high on the volatility index is a good thing!
- If selling ends at #3 we believe the situation remains inconclusive.
- If selling ends at #4 it will be bearish mid-term. Yes, we can see a bounce in March, maybe a strong one (depending how low stocks will fall). But the the series of higher highs on the volatility index is not a good sign, and it will suggest more and more aggressive selling will follow before summer. This bearish scenario will invalidate if the rounded reversal gets broken to the downside, so in other words if this index falls below the rounded reversal.
The bullet points above coincide with the numbers annotated on below chart.
This is the chart from back then:
This is what this Nasdaq volatility index looks like today:
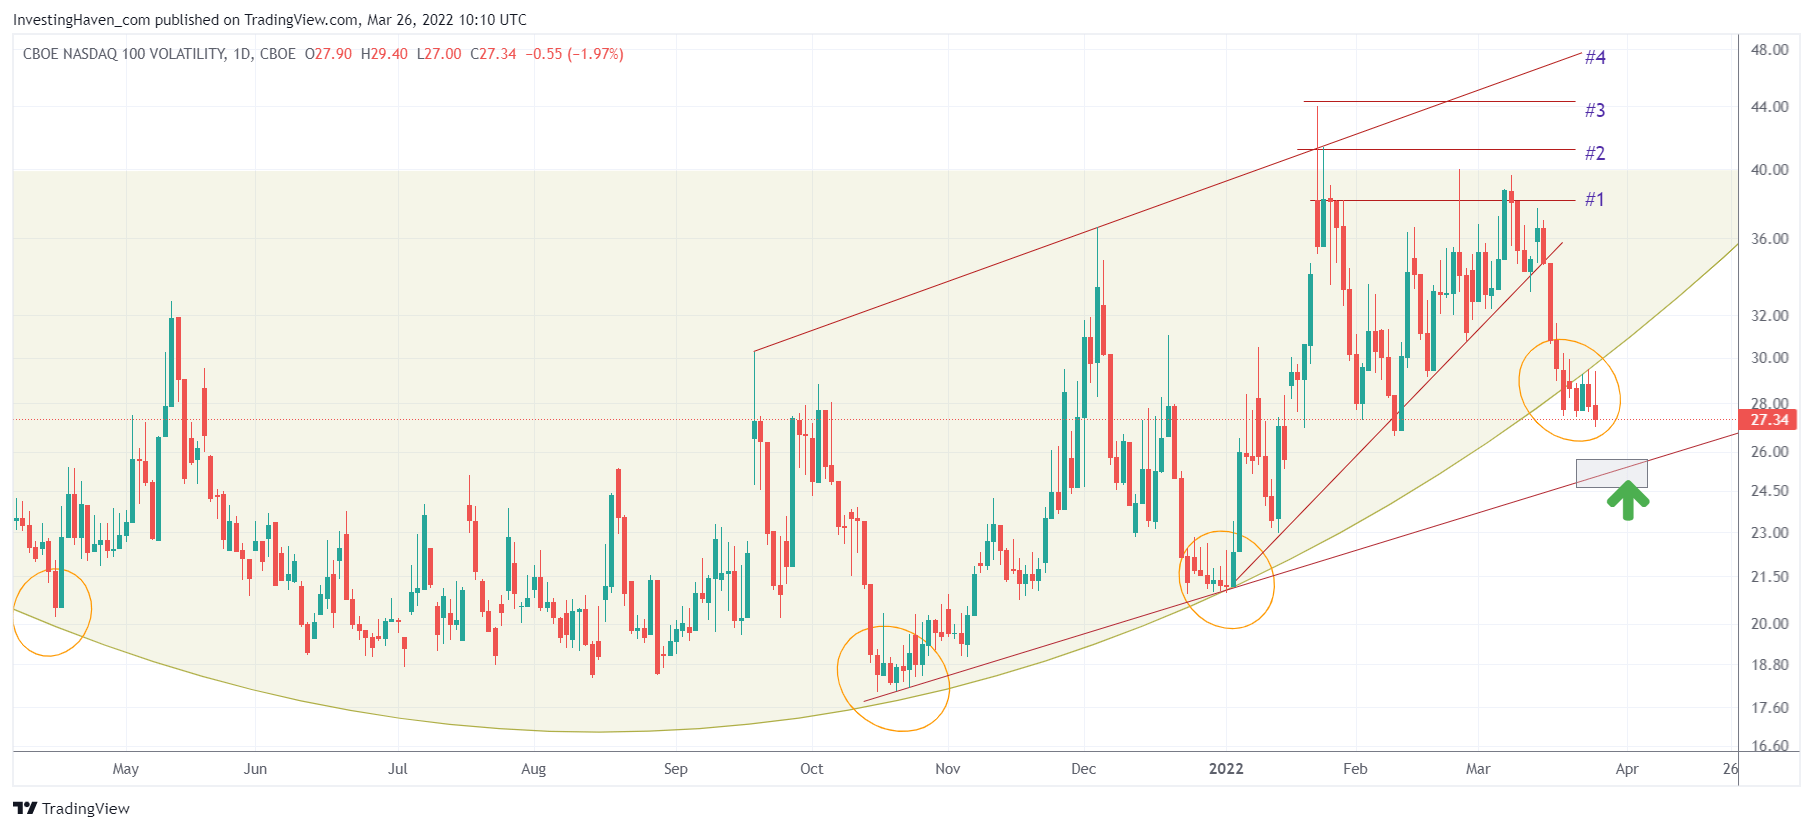
We get tremendous help in forecasting the Nasdaq by thoroughly analyzing the Nasdaq volatility chart.
At this very point in time, it is clear that the Nasdaq confirmed a bottom. It is also clear that the recent rally was too strong, we can reasonably expect a retracement to the 13915 area in the next week or two.
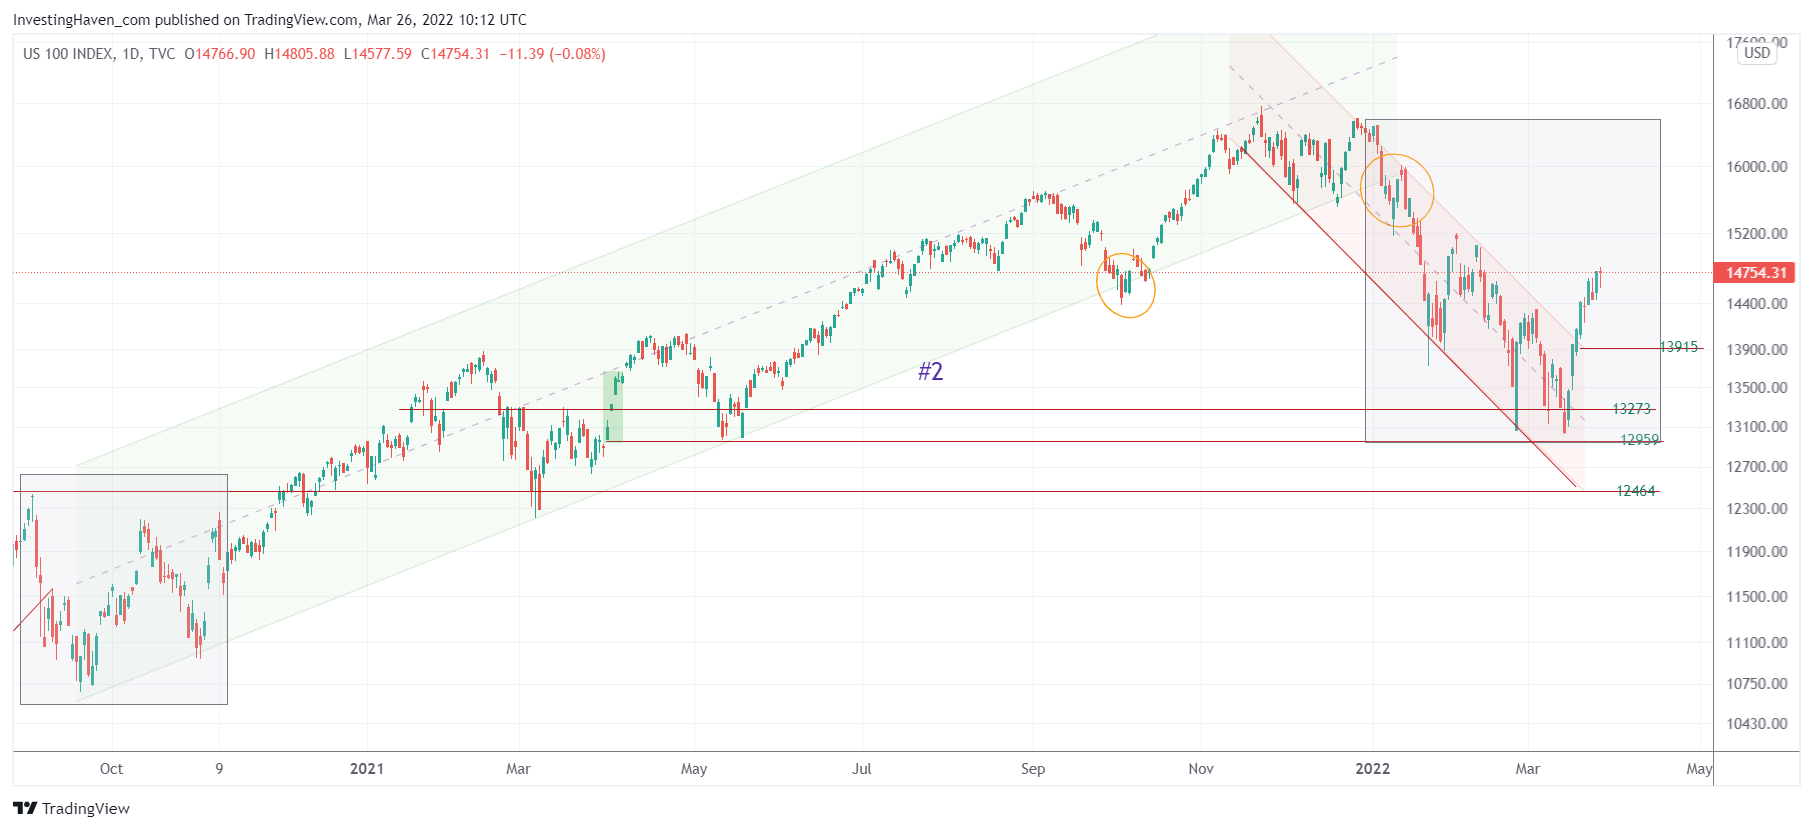
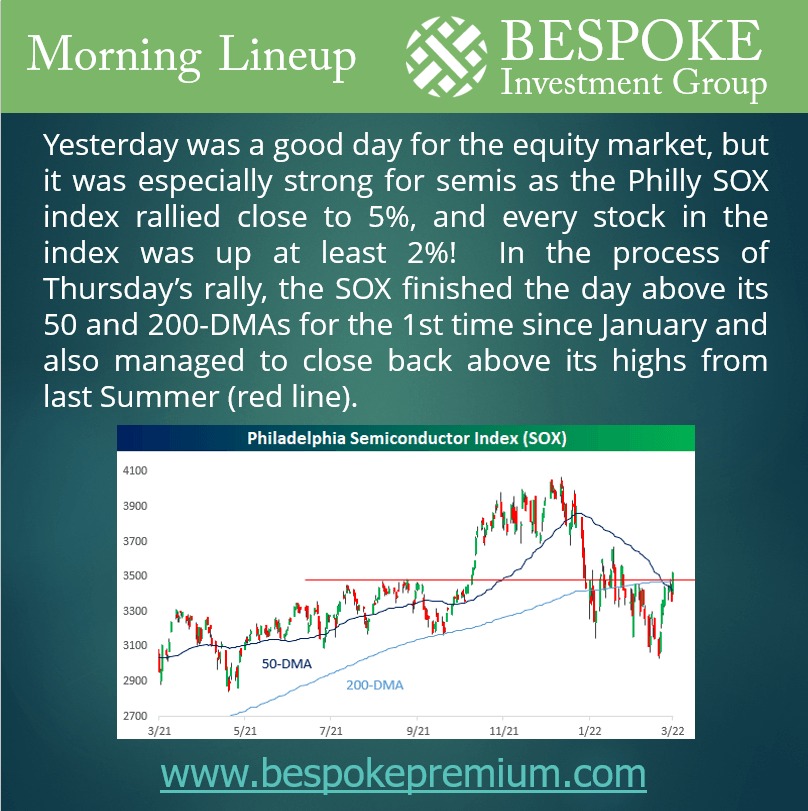
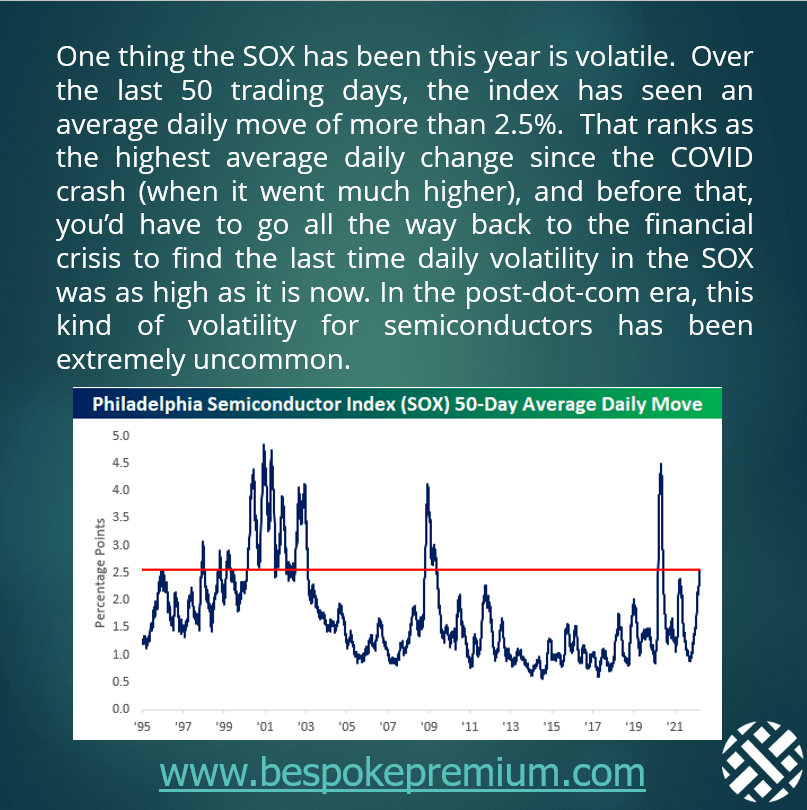
Within the Nasdaq we see that semiconductor stocks are among the leaders. It’s 3 months ago that semiconductors as a group traded above key moving averages. Fun fact, semiconductors have been moving intraday on average 2.5%, the strongest daily moves since the Corona crash (2020) and the Financial Crisis (2008).
In our Trade Alerts weekend alerts we include volatility index analysis as a fixed element of our analysis. Yes, this is a unique way to look at leading indexes and market trends. Reading and understanding volatility indexes is a challenging activity, it takes years before you understand how these indicators work. But one thing is clear: it’s worth the effort, because volatility indexes offer a tremendous help.


