Amid a global stock market sell-off this week it seems that emerging market stocks (EEM) did not get much of a bid. On the contrary. Shanghai had a horrible week, and even Indian stocks (NIFTY) did not do well. When it comes to Indian stocks we see that a decision level is reached now, and aggressive buying or selling will be the result.
As per our India stock market forecast these are crucial times for their stock market. This is the quote summarizing our viewpoint:
“If economic data and leading indicators continue to favor India’s stock market, and Nifty 50 continues to trade above 10,800 points, it will likely accelerate its rise. In this case we will see 15,000 points in India’s stock market in 2019. If 10,800 points cannot provide support we see a decline between 8,500 and 9,500 points, where a strong bottom will act as support. We anticipate a rise back to 11,000 points in 2019 in that scenario. In other words, the line in the sand for our India stock market forecast for 2019 is 10,800 points in the Nifty 50 index, combined with its 2 leading indicators and economic indicators.”
The Nifty 50 today closed trading at 10,472 points. In theory this is a breakdown, but we prefer to only conclude this on the monthly chart. I mean, in case of the 3 consecutive monthly closes below 10,800 points we would be in a neutral to bearish scenario.
So we have to give Indian stocks some more time to prove themselves bullish or bearish.
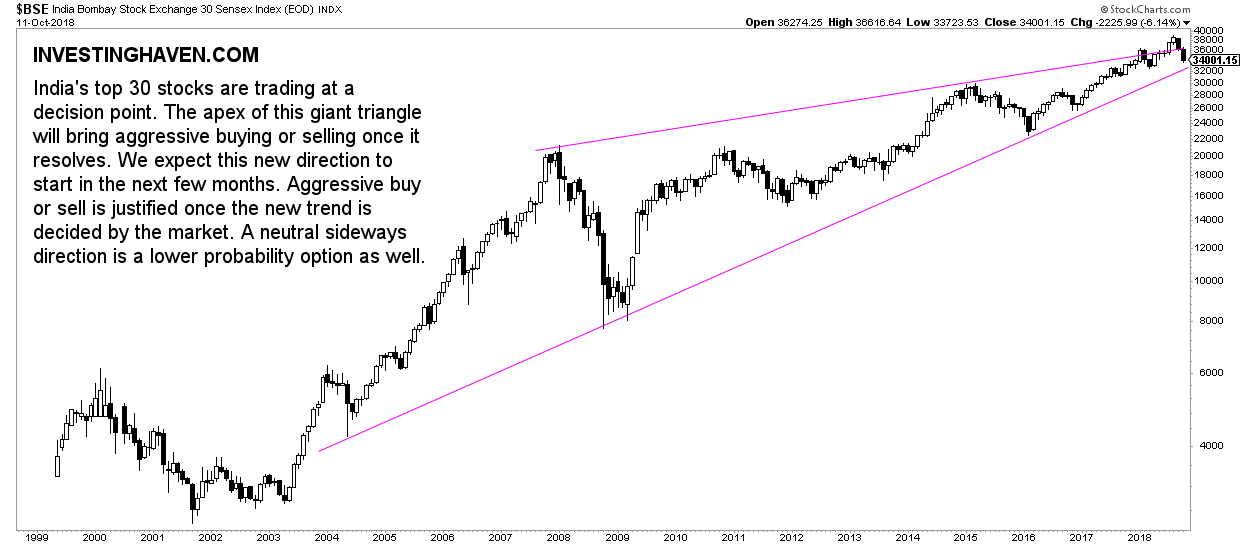
At the same time we see a confirmation of our make-or-break viewpoint on the top 30 Indian stocks chart: the BSE index. Below is its chart. This certainly categorizes as a must-see chart especially for Indian stocks.
Must-See Chart For The New Trend In Indian Stocks
The BSE index representing the largest 30 Indian stocks has a giant triangle formation, not often seen. Especially the duration of this triangle and how perfect this looks is amazing.
We strongly believe that once a direction is chosen, whether it is a breakout or breakdown from this triangle pattern, that aggressive buying or selling will take place.
In the meantime we continue to watch closely if this stock market sell-off will be THE stock market crash of 2018, and monitor closely what emerging markets do as well as Indian stock indexes Nifty 50 and BSE.