
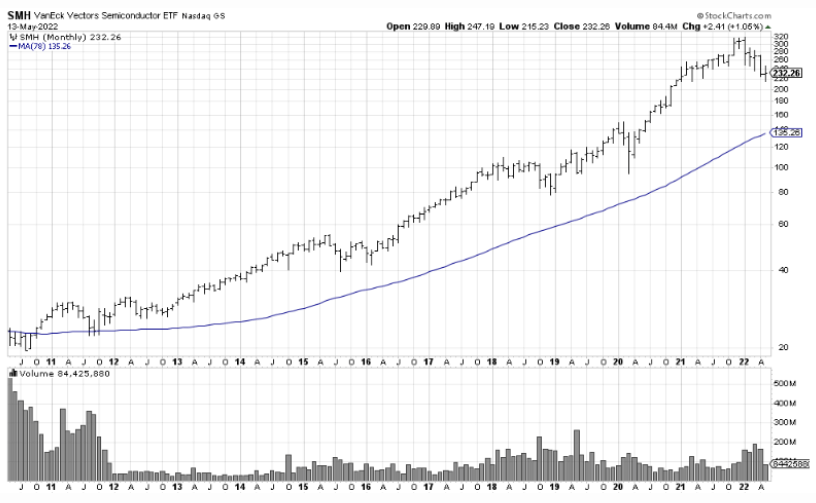
During the last 10 years, semiconductors offered multibagger returns. Given the heavy demand for microchips and the shortages in semiconductors, manufacturers’ stock prices rallied and we ended up with this beautiful strong uptrend. In hindsight, it appeared an easy forecast.
Last month, we saw a major industrial conglomerate buy a stock of washing machines to use the semiconductors inside (source)! This speaks volume of how crucial semis are to most industries nowadays and to what extent this technology is needed.
The question now is will this uptrend in Semiconductors continue? Are we currently witnessing a buyable dip or a reversal (major top)?
Hard to tell but we’ll give it a try. We look at trends, patterns, probabilities but at the end of the day what matters is spotting the key price levels. Once that’s done, we want to see how the price acts around those levels and be quick to confirm that the plan is working and even quicker to see if the price is going against us and exit. This is key to surviving in today’s volatile markets. We all want to make money, learn how to interpret and analyze charts but really it’s all about managing risk and surviving to trade another day.
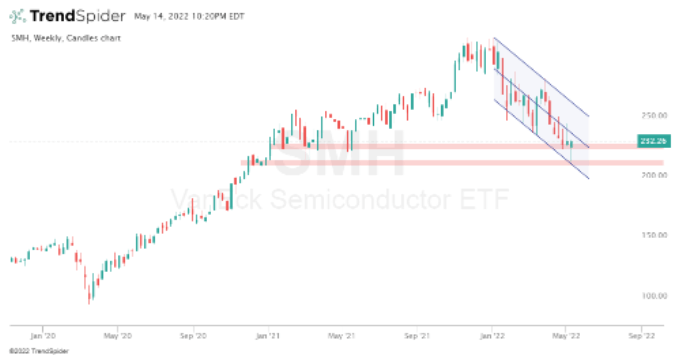
To answer whether we have a dip in Semiconductors’ price or a reversal, let’s start with The VanEck Semis ETF Ticker SMH which has been on a strong uptrend for years now (monthly chart):
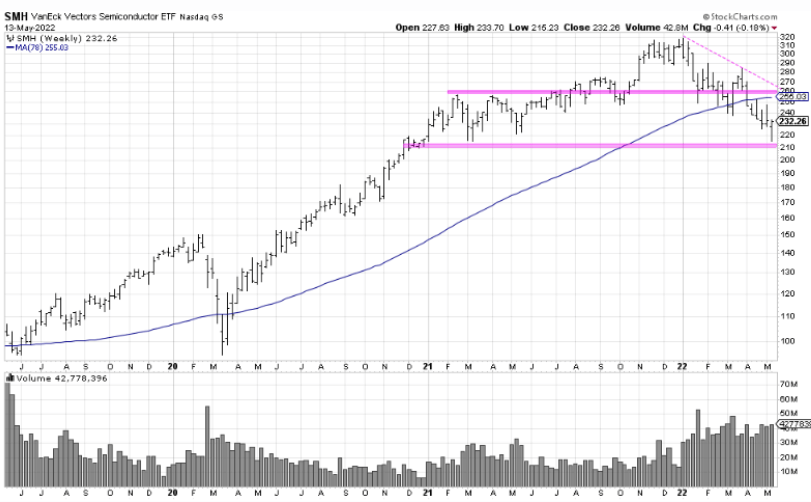
The weekly chart shows how we are at a support level. The bulls need to defend that $210 area otherwise we can see the price dip further. We also have some overhead resistance in the $250 to $260 area.
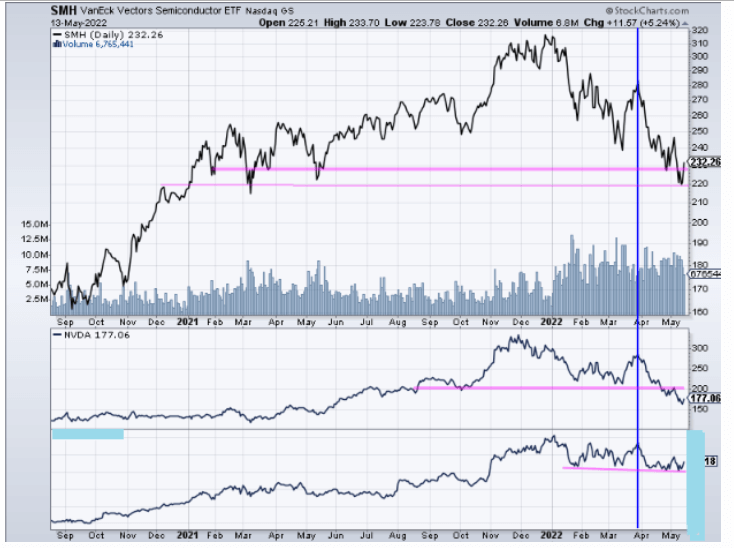
The daily chart is showing a similar setup, similar price levels and actually emphasizes the importance of that $210 support level.
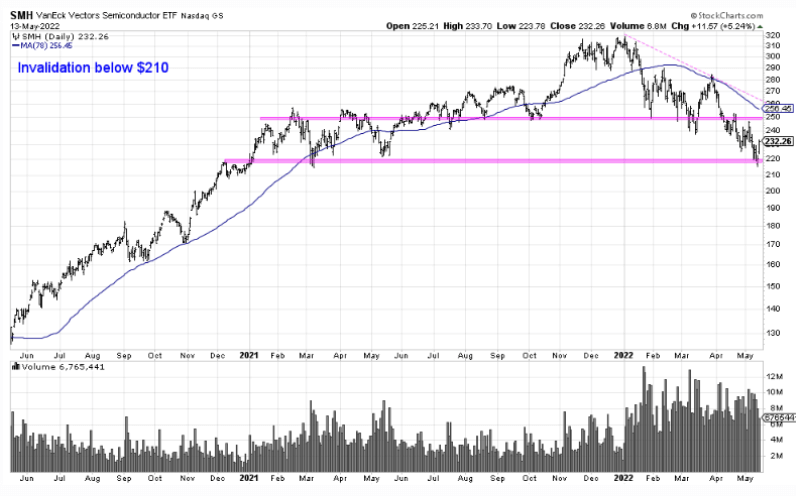
Another view here showing the importance of that $210 level
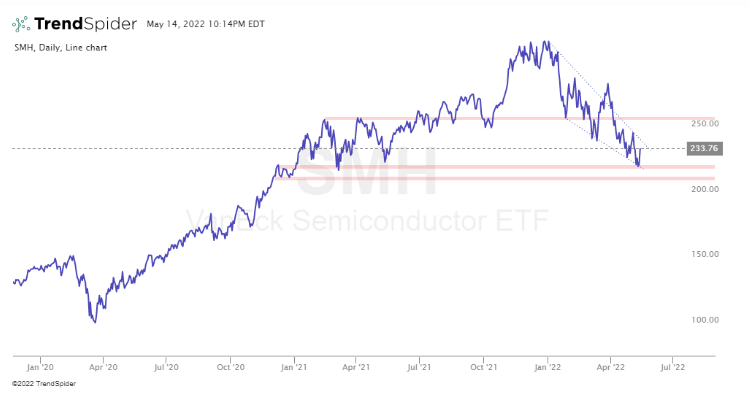
And a close up to show how we have a bottoming candle but we need to see confirmation
So if SMH is a good representation of the sector, we are hitting support levels on multiple timeframes that could lead to a reversal.
Now let’s look at NVDA, the stock that many would consider a sector leader. Similar to SMH, we have a potential bottoming candle right at support. We can see a head & shoulders break, downside target achieved hence the bounce.
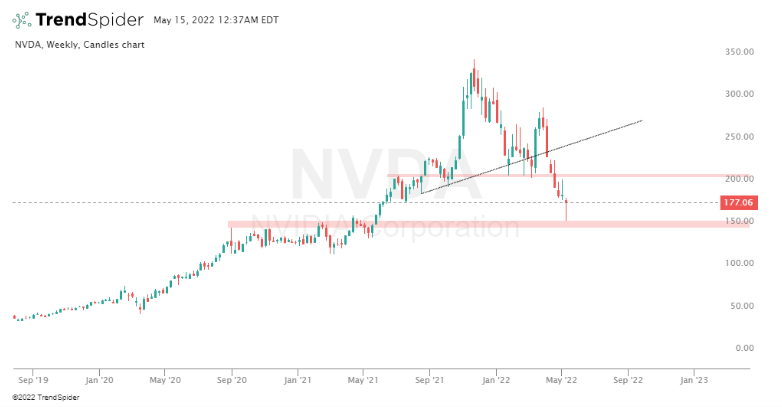
So are the wicks on the candles above shorts covering or the first sign of a reversal, that’s what our team will be watching for the next few days as we are in an extremely volatile period and it would be foolish to just assume that the potential for more downside is out of the question. However the signs so far favor the reversal probability provided the highlighted levels hold. The heavy demand for microchips is here to stay and pull backs if paired with proper risk management can provide excellent entries.
Now something our research team likes to do when sectors are pulling back, is identifying the players showing relative strength during uncertain times. Those resilient stocks will likely recover faster and outperform peers. So this is really the time to find those potential emerging sector leaders that will outperform during the next leg up.
Those are the gems we like to uncover for our alert service subscribers. It’s all about spotting the opportunities early while controlling risk.
See the chart below for an overview of How VanEck Semiconductors ETF held after that temporary top in April, compared to NVDA, the sector leader and see how our favorite semiconductor pick held strong and will likely outperform once the sector picks up.
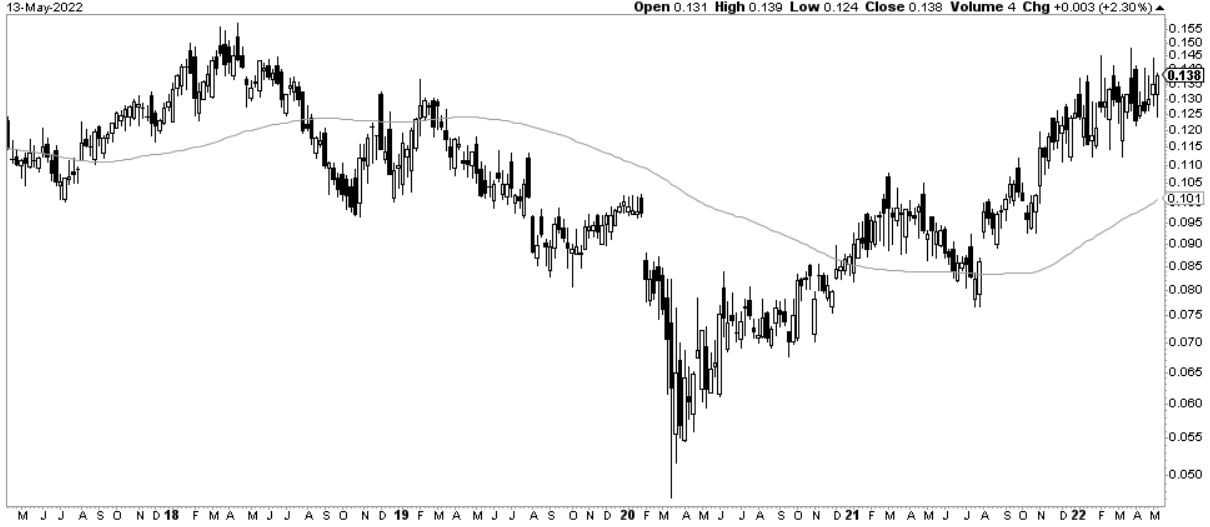
In our Momentum Investing stock analysis and ‘look over the shoulder’ portfolio service we are in the process of taking a consolidation position on the most beautiful, powerful and valuable semis stocks (as per our analysis). The relative chart of that stock against the sector is shown below. While all semis have declined in recent months, this one gem is among the few that respected a truly key support level (breakout last year). It is showing relative strength and the chart below shows a giant inverted head & shoulders in the last 5 years attempting to start a secular breakout. There are good reasons why we are going overweight in this semis stock in our Momentum Investing portfolio, the potential upside potential by end of this year is 100% provided the markets have set a bottom last Thursday.
Written by hdcharting, reviewed by Taki Tsaklanos


