The Euro plays a very important role in the financial market ecosystem, as said many times in the past. We consider it a gauge for risk sentiment in financial markets. In this article we take a look at the very long term timeframe, and there is a veyr interesting finding on the secular Euro chart.
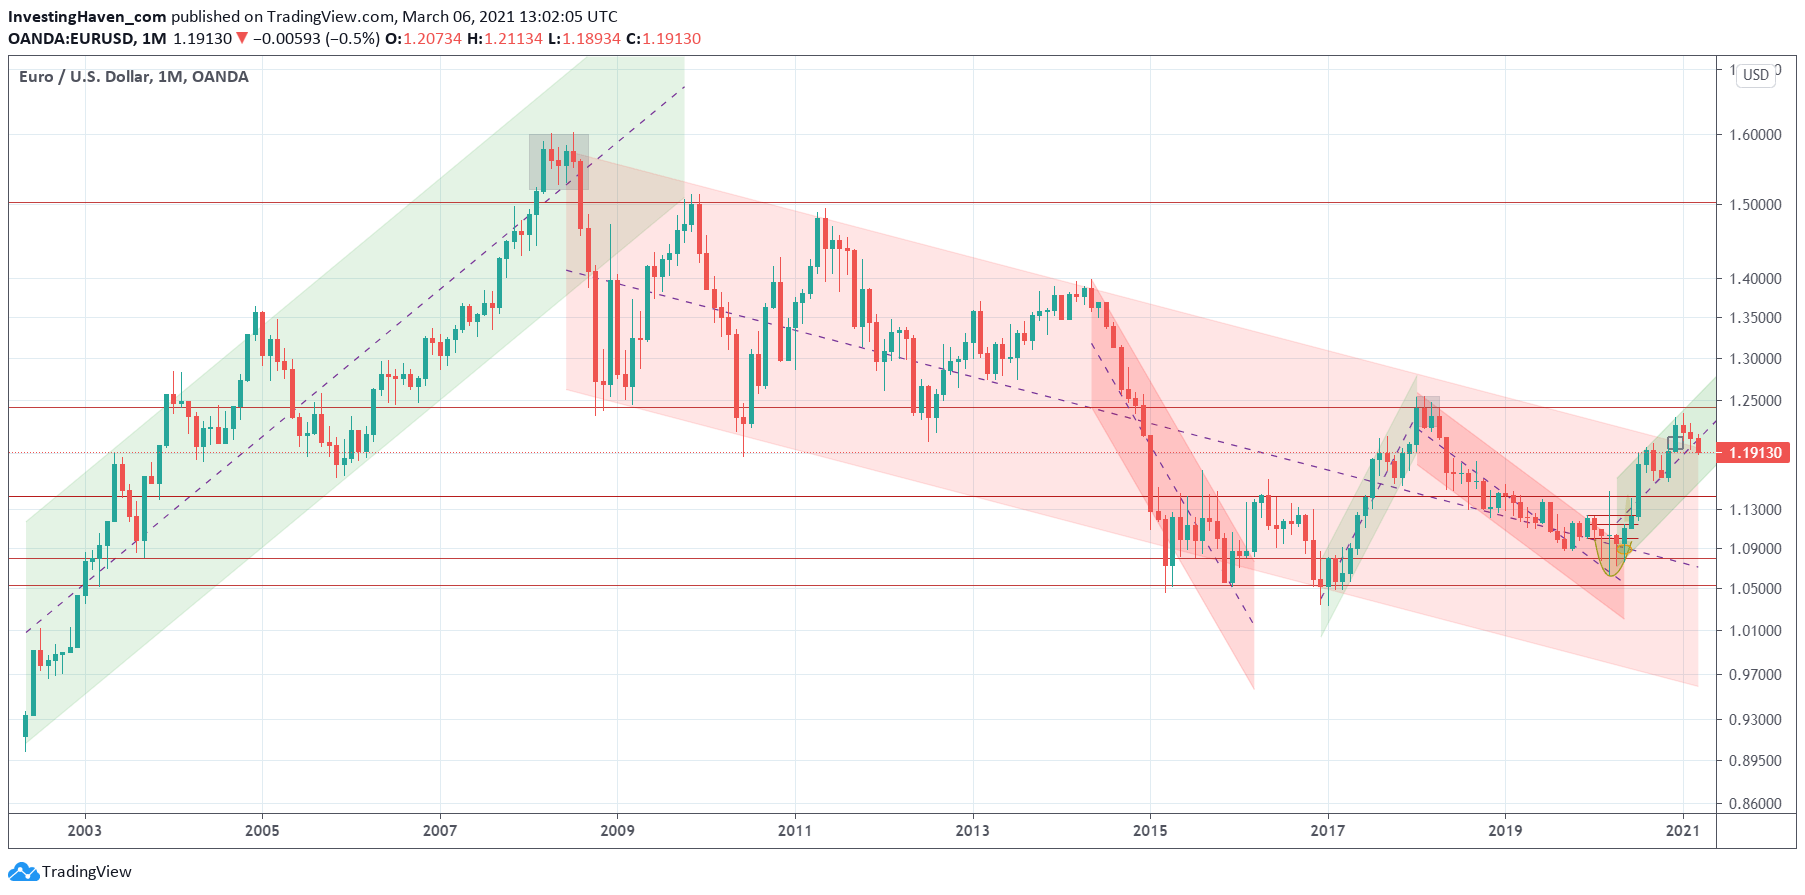
The secular Euro chart (nearly 20 years) has essentially two phases: one major trend higher until 2008, and one major trend lower since then.
Interestingly, the Euro started moving (strongly) higher since the Corona crash lows. In chart terms it ‘bounced’ from its bear marker trend line.
In essence, up until last month, the Euro was in a tactical uptrend in the context of a secular downtrend.
The most interesting finding from the secular Euro chart is that it recently tried to break out from its secular downtrend. However, it didn’t succeed.
The last 2 monthly candles, hard to see on the chart below, are not really great, but not concerning.
However, March will really be a crucial month. As in, really crucial. That’s because if the Euro sets a solid red candle we might see a topping pattern … in which case the picture would not look really promising. The opposite is true as well: a monthly close (way) above 1.20 would result in a small (or even tiny) red candle which wouldn’t imply a lot of damage was created on the secular chart.
We’ll have to watch the monthly close of the Euro, as it might be decisive for the stock bull market in 2021. A monthly closing price that is close to the open price of March 1st would be great.
Don’t expect such a secular breakout to happen easily. It will require at least 2 attempts.
For chartists, watch how the 2015/2016 period marked a giant bullish W-reversal pattern. In a way the 2018/2020 period was sort of a ‘handle’ in a giant ‘cup and handle’ formation. The 1.25 level has been acting as resistance in this long term formation. We might need to see a mini-handle in 2021 … or a failed attempt to break above 1.25.
March and April of 2021, especially the monthly candles we’ll see on this long term chart, might be telling.