We feature the Russell 2000 from time to time because we consider it our global stock indicator, and it helps us forecast markets. It is a barometer to understand how bullish stocks are, not only in the US (per the S&P 500 or Dow Jones) but also globally. If anything the Russell 2000 is ultra bullish, it was so bullish that it even went parabolic for a few days. For how long this party will go on is unclear, but if anything the bullish strength in this market is exceptional. This is why.
The way to think of the indicator role that the Russell 2000 index plays in our methodology is very simple. We look at trends, we look at patterns, on the daily and weekly timeframes, and try to understand strength.
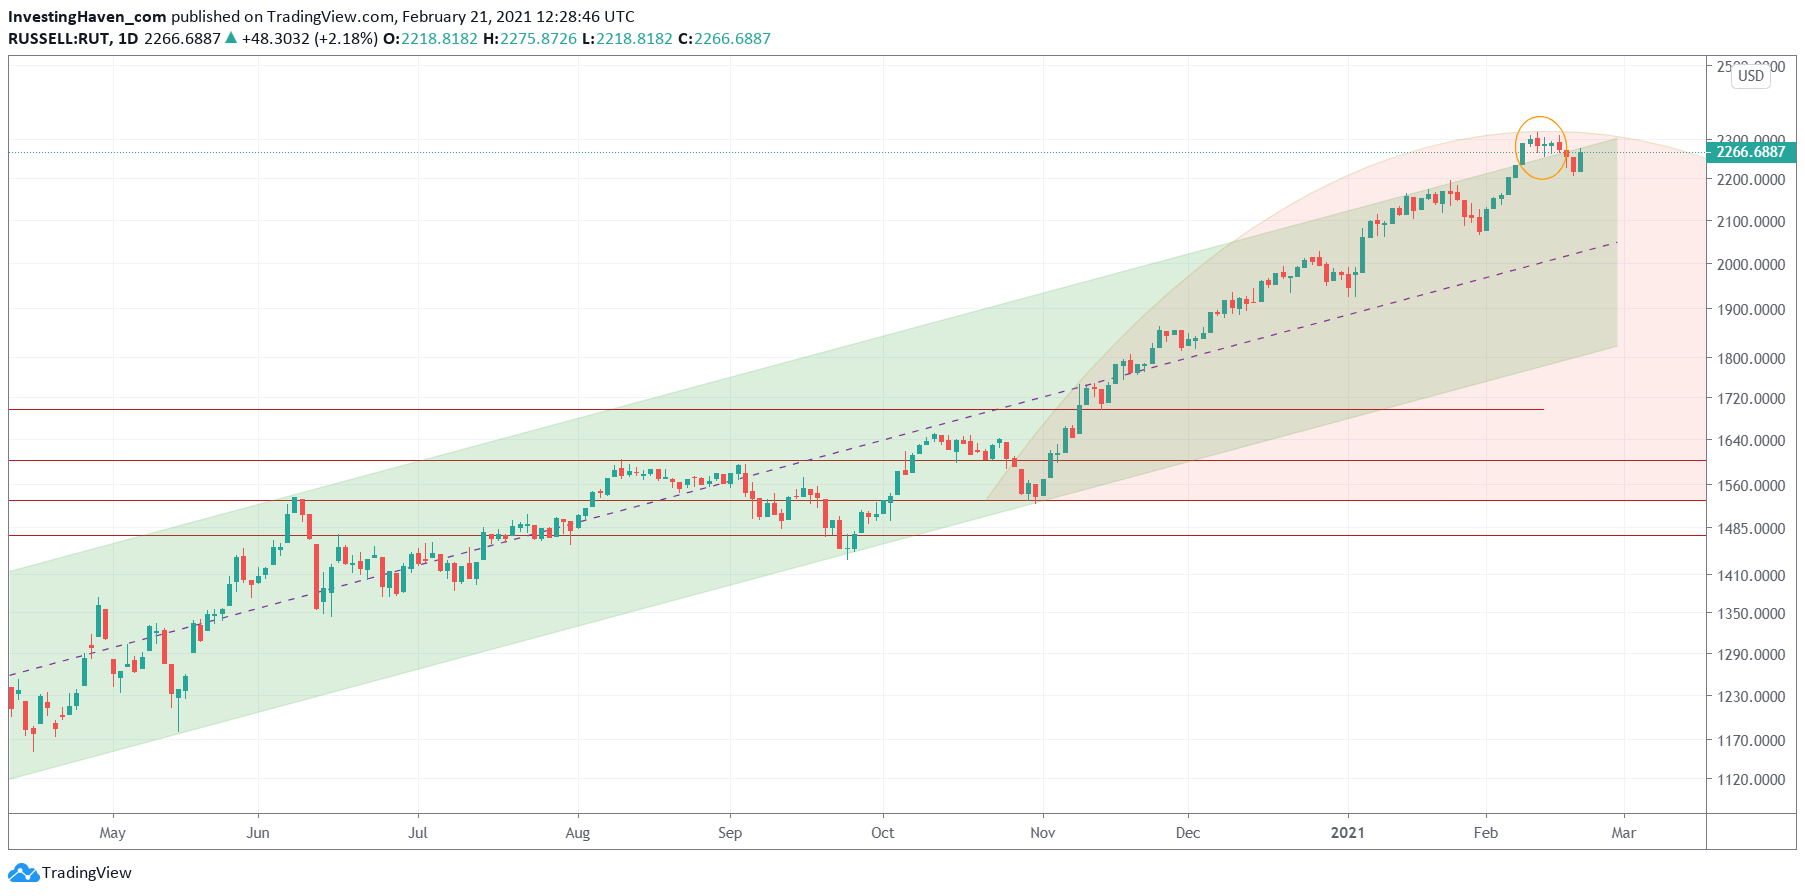
With that said if we look at the daily Russell 2000 chart we can observe a few things as it relates to trends, strength and patterns:
- The uptrend since April of last year.
- The slowdown between August and October.
- The acceleration since November.
- The continued attempts to go back to the top of the channel, in January and February.
- An attempt, one week ago approx., to even rise outside of the 11 month channel. It eventually failed, we would almost say ‘obviously’.
Extremely powerful, that’s what it is. No surprise, global stock markets are mostly bullish. Think of some emerging markets like India (Nifty50), European markets, Brazil, etc.
The one question that comes to is mind is if and when a healthy retracement will start. In the end, retracements are good. The provide the necessary energy to continue an uptrend.
We try to understand retracements based on bearish topping patterns. The one red topping pattern on below chart is the one we currently have. This pattern is not set in stone, it may be broken to the upside, but eventually the Russell 2000 will find resistance at one of those points (current or higher levels).
We are no perma bulls, we are no perma bears, we simply want to protect downside and maximize upside, in that order! And we love to buy quality stocks at discounted levels, which is one of the reasons we are keen on forecasting retracements (their start, their end, their buying opportunity).
Moreover, understanding retracements helps you stay in your FLOW. You don’t want to initiate new positions that go in red right after opening them because indexes start a correction.
As per our must-read guide for investors, only available to Momentum Investing members, 99 Common Mistakes 99 Pct of Investors Tend To Make
Tip 92. It is crucial to be in your ‘flow‘ when investing. You’ll have to feel that balance between working, watching a position and other activities in life. If it feels out of balance, something is wrong and you better take a step back.
We believe the Russell 2000 index is not far away from starting a correction. It’s not going to start immediately, but it’s not to last another month.
Follow our work in our Momentum Investing service to get weekend updates with detailed market analysis.