
We did not cover the Euro post-Corona crash. The Euro is and remains the leading indicator in our methodology. Let’s review the latest and greatest insights from the different Euro chart timeframes in order to understand what this may mean for global markets.
Let’s keep this analysis short and sweet. We’ll focus on the Euro charts, and insights that we can derive from it.
The monthly chart comes first, on approx. 17 years.
Essentially, the Euro was bullish until 2008 and bearish since then. Very simple long term dynamics.
Within the 10 year bear market though there have been a few cycles. The first one is a consolidation in the 2009-2014 time period. Next was a heavy sell off which induced the crude oil crash of 2015. In 2017 there was a strong bull market in the Euro which resulted in a very strong RISK ON sentiment in global markets (that’s when the crypto was going through the roof, similar to pot stocks and other high beta markets).
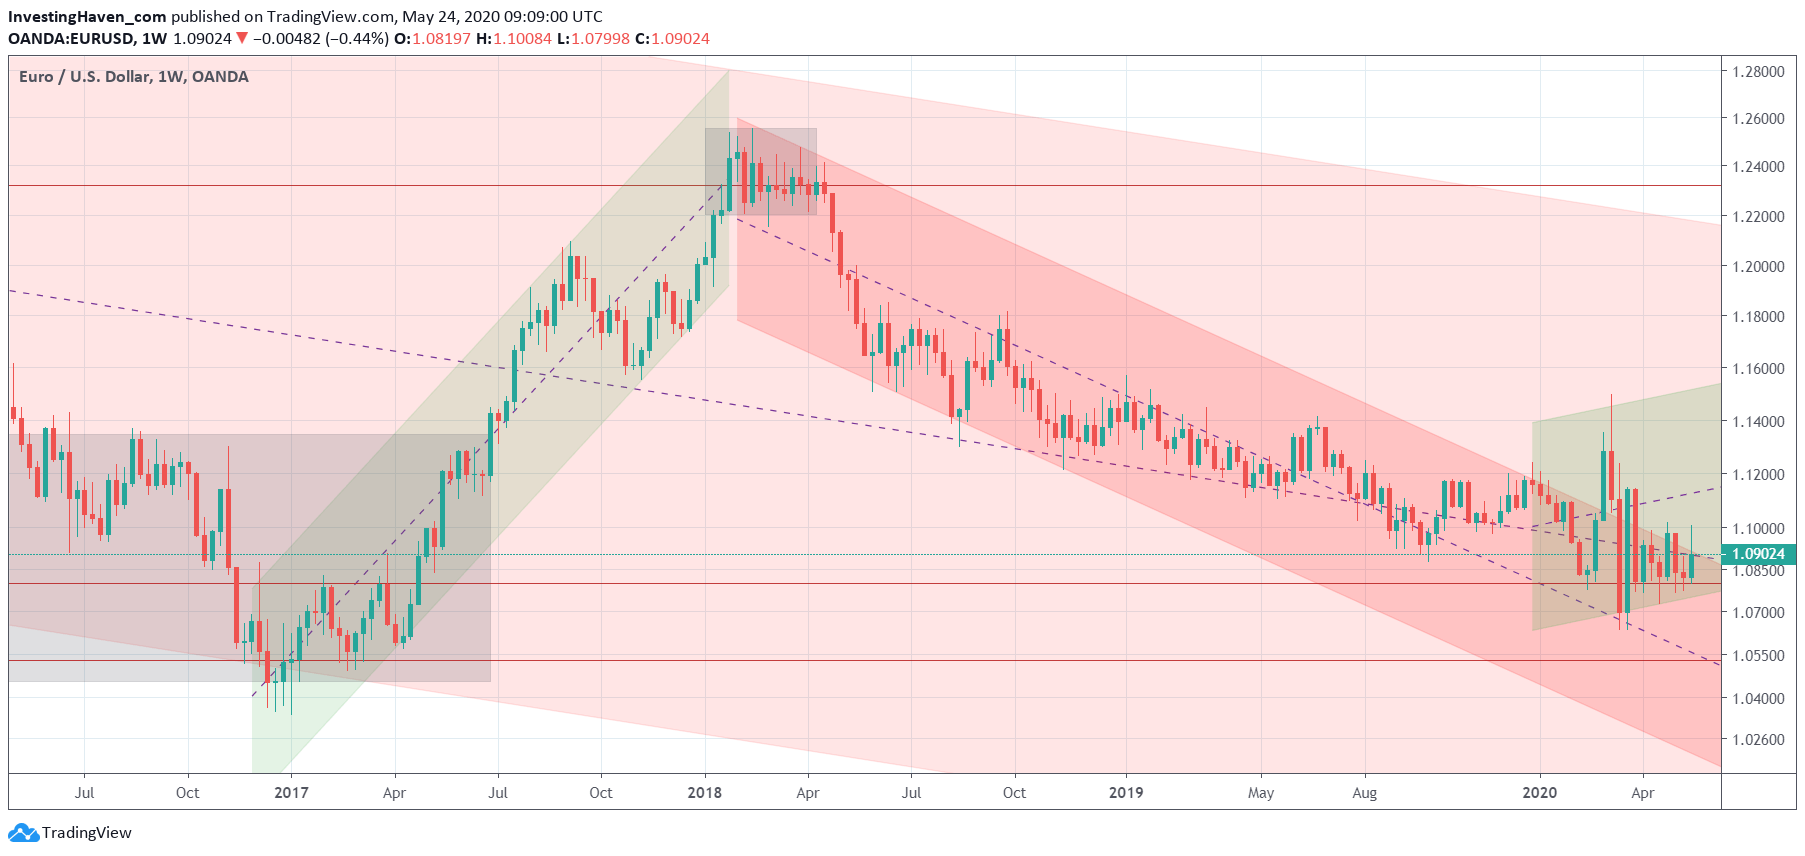
The weekly chart on 4 years should give us more insight into the 2 recent cycles: the 2017 uptrend in the Euro (which created a strong RISK ON uptrend in global markets) as well as the subsequent bear market.
All we can say is that the Euro bear market that started early 2018 is not as aggressive and that the decline started decelerating a year ago.
Moreover, in recent months we observe huge weekly candles which are very important but don’t give us incremental insights on this timeframe.
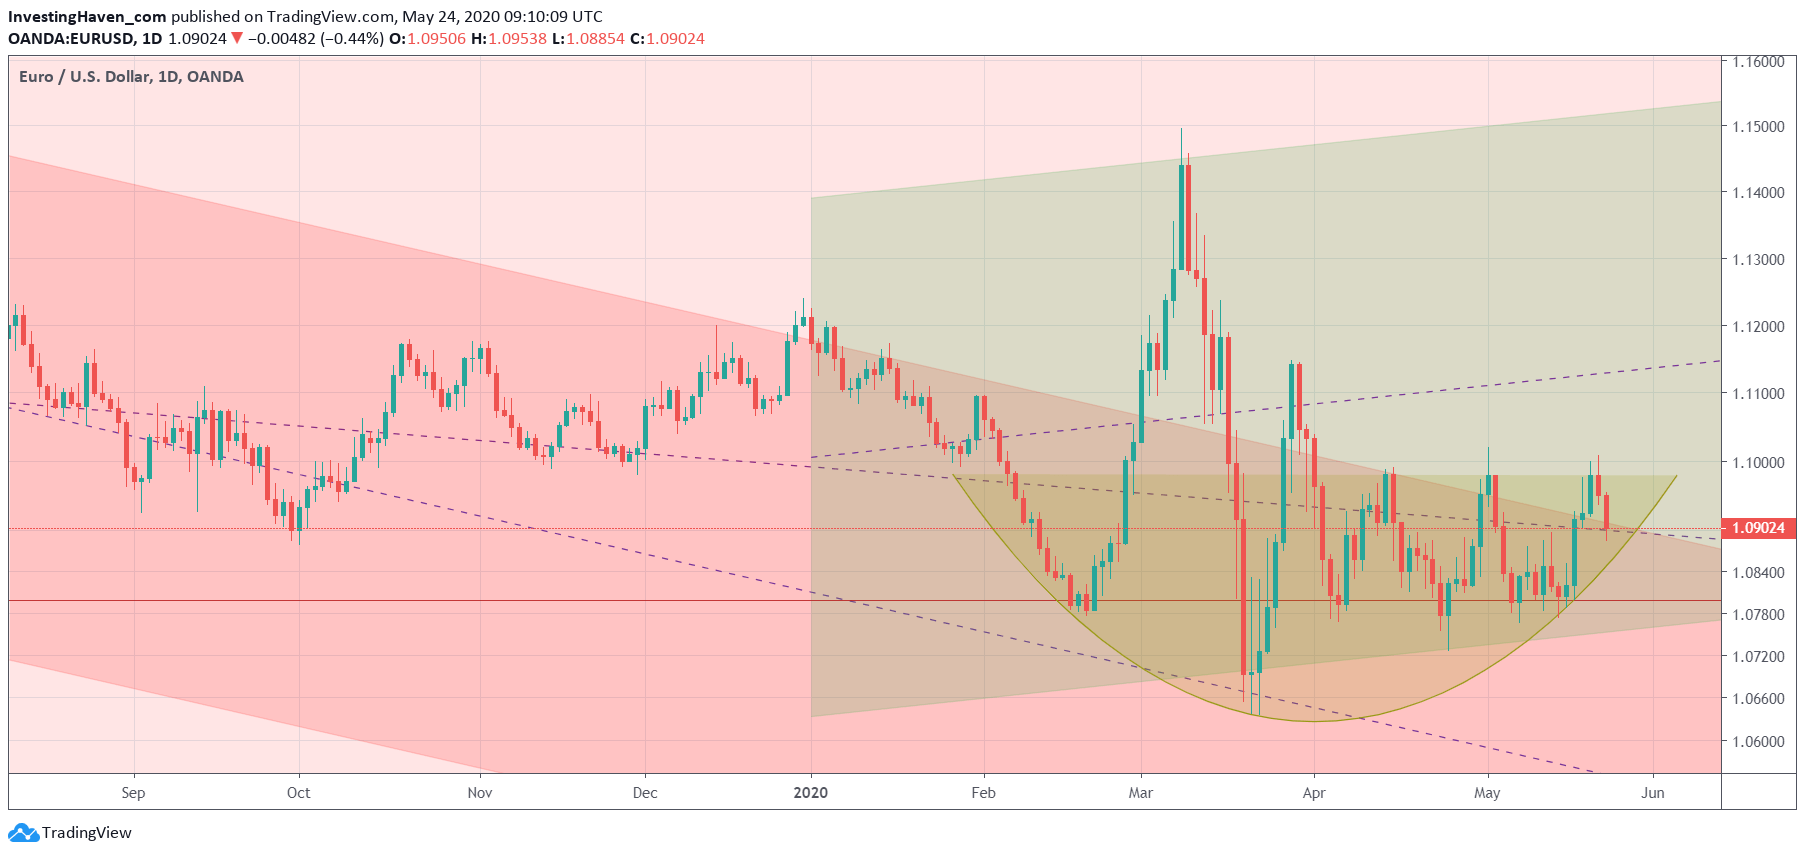
That’s why we need the daily chart on less than one year.
The lower the timeframe the more insights we get on ongoing price action as well as trend changes.
Here it becomes really interesting, because we see particularly 2 things that grab our attention.
- The huge spike up in March, followed by a huge sell off (also in March). According to us this ultra volatile price action which resulted in giant candles set the stage for a new uptrend in the Euro. We did indicate this in green on below chart. It’s our best guess, a prediction we want to formally make in the public domain: the Euro is going higher in 2020 and 2021, and it will introduce RISK ON again in global markets.
- The reversal that started in February of this year, which we indicated in yellow (rounded pattern). This is an equally important pattern as the one explained in the previous point, and is really decisive. Note that the reversal pattern may be close to completion now, and that the last daily candles are all above the 2018/2019 downtrend.
Moreover, if we read points 1 and 2 in conjunction we come to a confirming conclusion (not diverging).
What do we conclude from the multiple Euro charts?
The most likely path of global markets is that the Euro is going to introduce a new RISK on wave, once the Corona crash aftermath effects start fading. The daily chart confirms this. We need Euro readings above 1.09 to know for sure.
This bullish Euro trend is happening in the context of a secular downtrend. As long as the Euro remains below 1.20 it remains in a (very) long term downtrend. This means that RISK ON cycles don’t last very long (not more than 1.5 years).
Do you like our analysis? You can follow our work with our look-over-the-shoulder investing method and strategy as per our Momentum Investing service. Moreover, on the short term timeframe, we apply a proprietary method with short term trading signals in the S&P 500 which delivered +70% so far in 2020.


