
One week ago, we suggested that the Nasdaq was moving to a pretty scary bearish target. We expected it to be hit in the first days of March, as per our cycle count. However, with the Russian invasion we got the sell-off a few days earlier. Bearish target hit, what now? Are tech stocks a buy or should we avoid them for as long as possible?
This is what we wrote last week: Nasdaq Selling About To Accelerate. What’s Next: Exhaustion Selling Or A Real Crash?
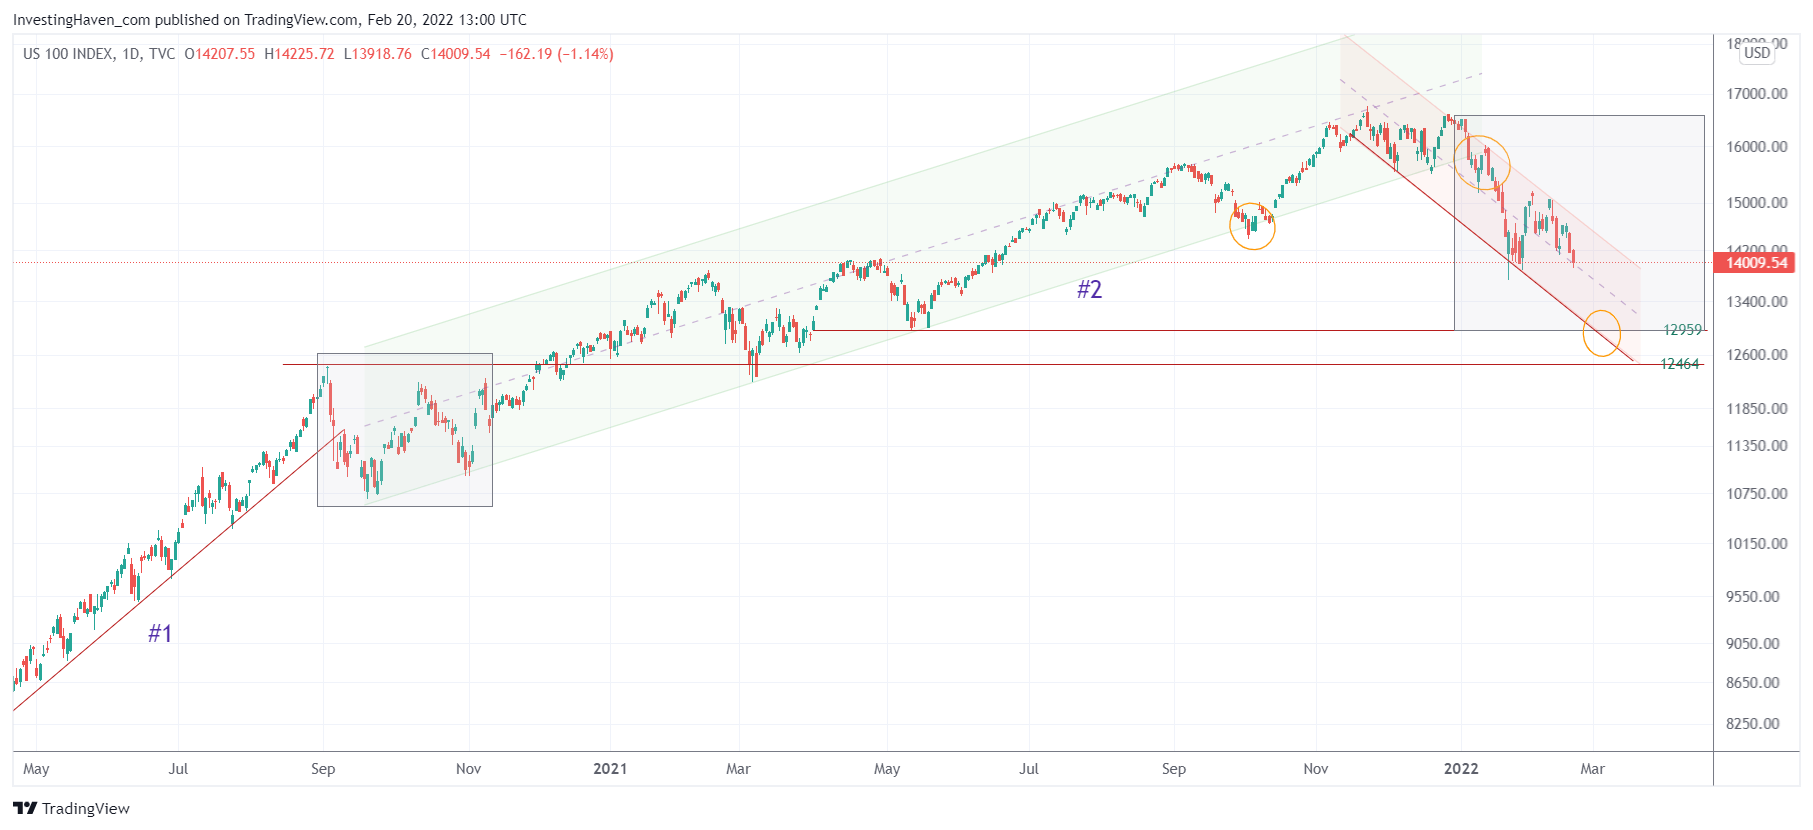
As long as 12464 is respected we believe we remain in a long term uptrend. Don’t forget, the ongoing volatility can be part of the long term uptrend. We got a less volatile period in Sept/Oct of 2020 (see grey box), after the first ‘leg higher’ in markets, as seen on below chart. This came with a 2nd ‘leg higher’. Because this index has been rising (higher) for a year (longer) than the first ‘leg higher’ it implies that the subsequent consolidation will be more intense and will take longer (please compare the two grey boxes).
This is the chart from that same article which we released a week ago.
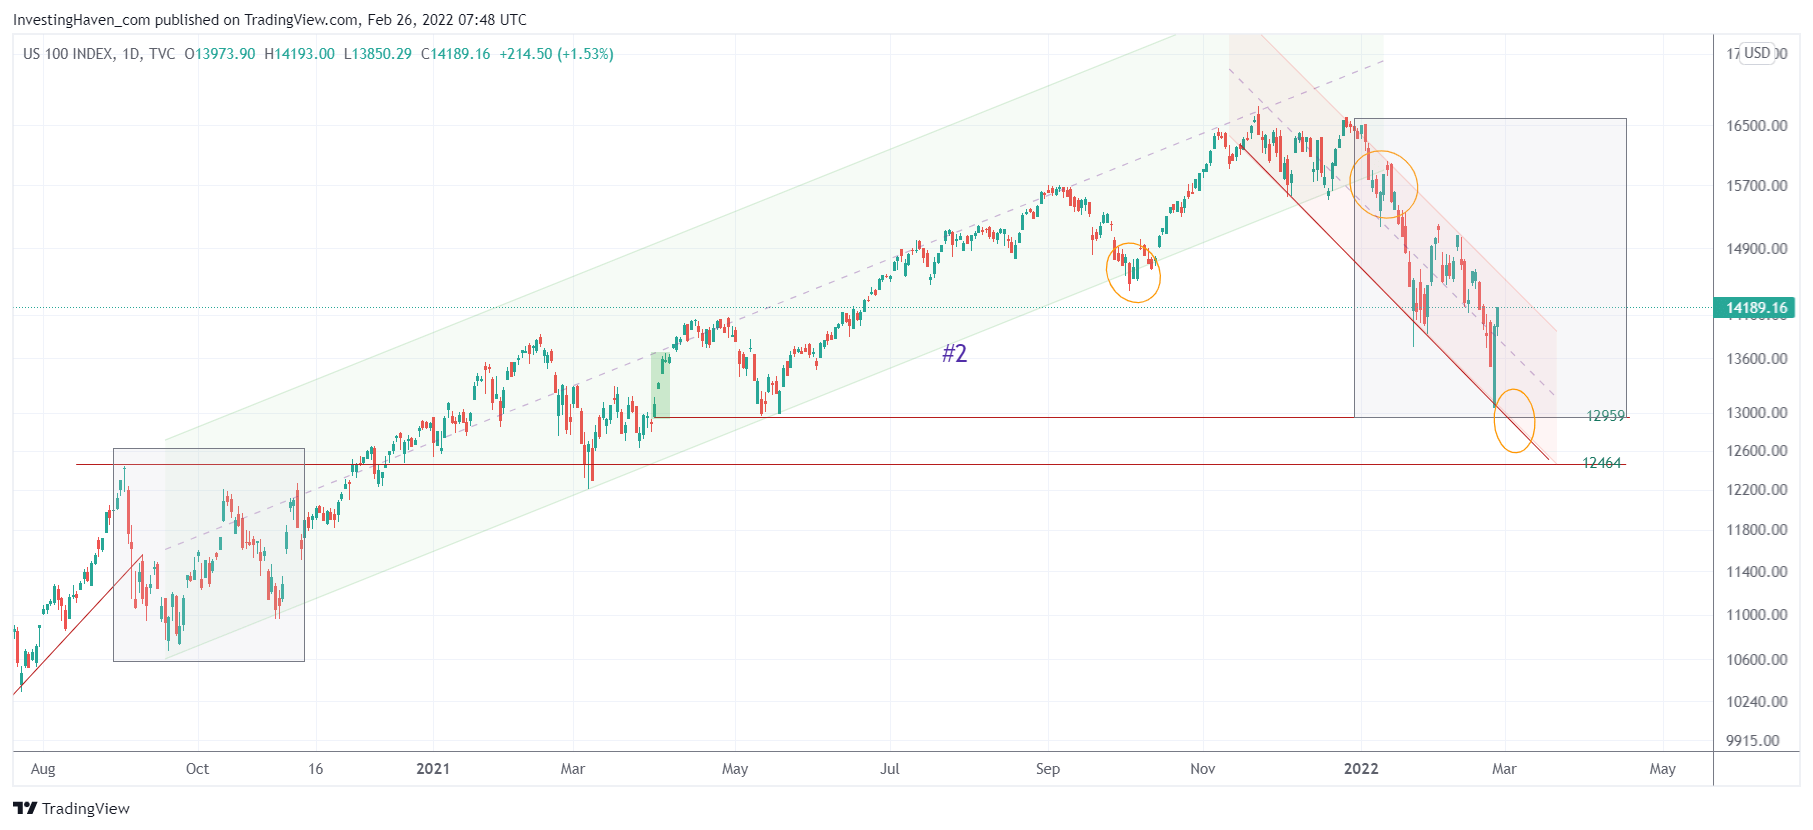
Fast forward to today and we see that the Nasdaq chart hit almost exactly the target that we had laid out. In fact, our target was 12959 points while the intraday lows of Feb 24th were 13033 points.
As per the volatility index chart of the Nasdaq which we featured in our premium services yesterday we believe that the downtrend may be coming to an end now. The volatility index chart suggests that a consolidation, presumably a very volatile consolidation (in both directions), is in progress now.
What’s important, as of next week, is to closely watch how the Nasdaq will ‘behave’ on weakness. Readings above 13600 for the entire day, especially daily closing prices, would suggest that a turning point is in the making. However, below 13600 (3 day closing basis) as well as a breach of the 12959-12464 area would be horrible news for stock market bulls!
Details of our findings are available on the Nasdaq volatility chart which is available for anyone who signs up to our premium services Trade Alerts and Momentum Investing.


