
The Nasdaq volatility index is getting more scary than ever. Its aggressive profile is confirming what we are saying for a long period now: a bigger sell-off is underway. Is a buy opportunity underway or is this the start of a mega crash?
Back in December we wrote Should We Prepare For A Flash Crash In 2022 Similar To The One In 2015?
Risk is rising, and we need leading indicators to confirm a bad outcome. They are not in an alarming area yet, but they are also not far away from a concerning setup. We are sort of in a limbo state, right below ATH in several leading indexes (not so in the Russell 2000 though).
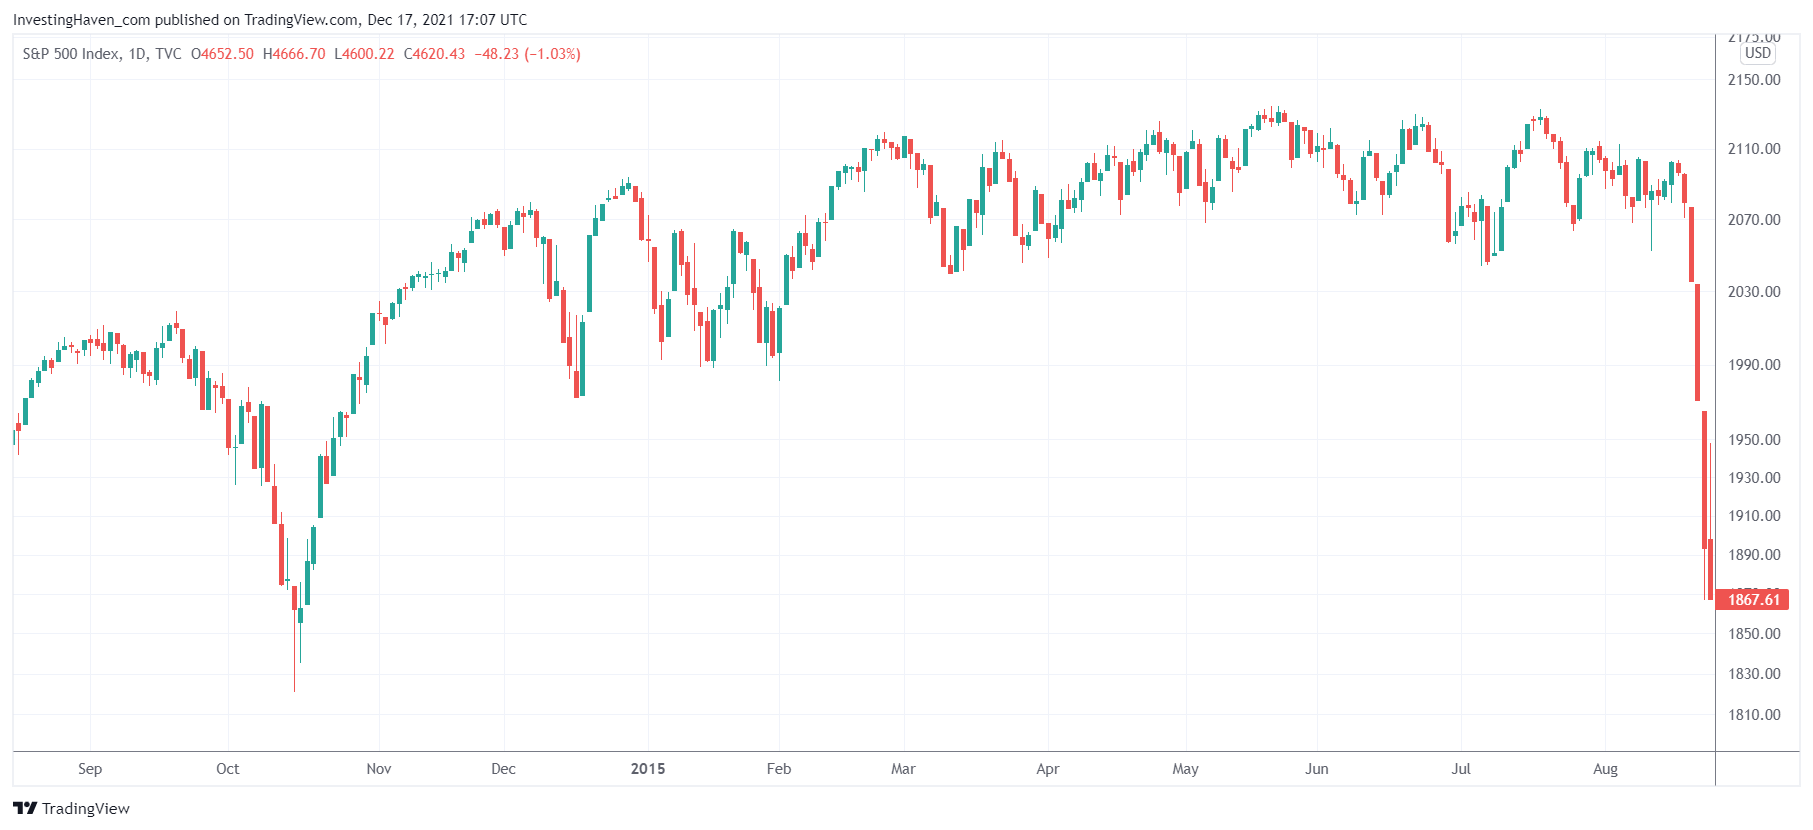
We compared the Russell 2000 setup of 2021 with the SPX setup in 2015. The outcome in 2015 was a flash crash, and we concluded we should be mentally prepared for a similar outcome early 2022.
 Last week we wrote Fasten Your Seat Belts: Volatility A Pressure Cooker, Is A Flash Crash Underway?
The Nasdaq shown below is by far the most aggressive volatility index. It shows an acceleration in the bullish reversal. Bullish volatility is bearish stocks. The market is now aligned in its intention: lower before a move higher. Some segments will be hit hard in the next 2 to 3 weeks. We cannot rule out a flash crash, it might not happen but we believe one aggressive wave of selling is near. A quick drop to 1716 in the Russell 2000? One that will be bought intraday, and a few days later we are back near 1900? Why not? This market is merciless, violent, this is certainly a feasible scenario is what we are thinking.
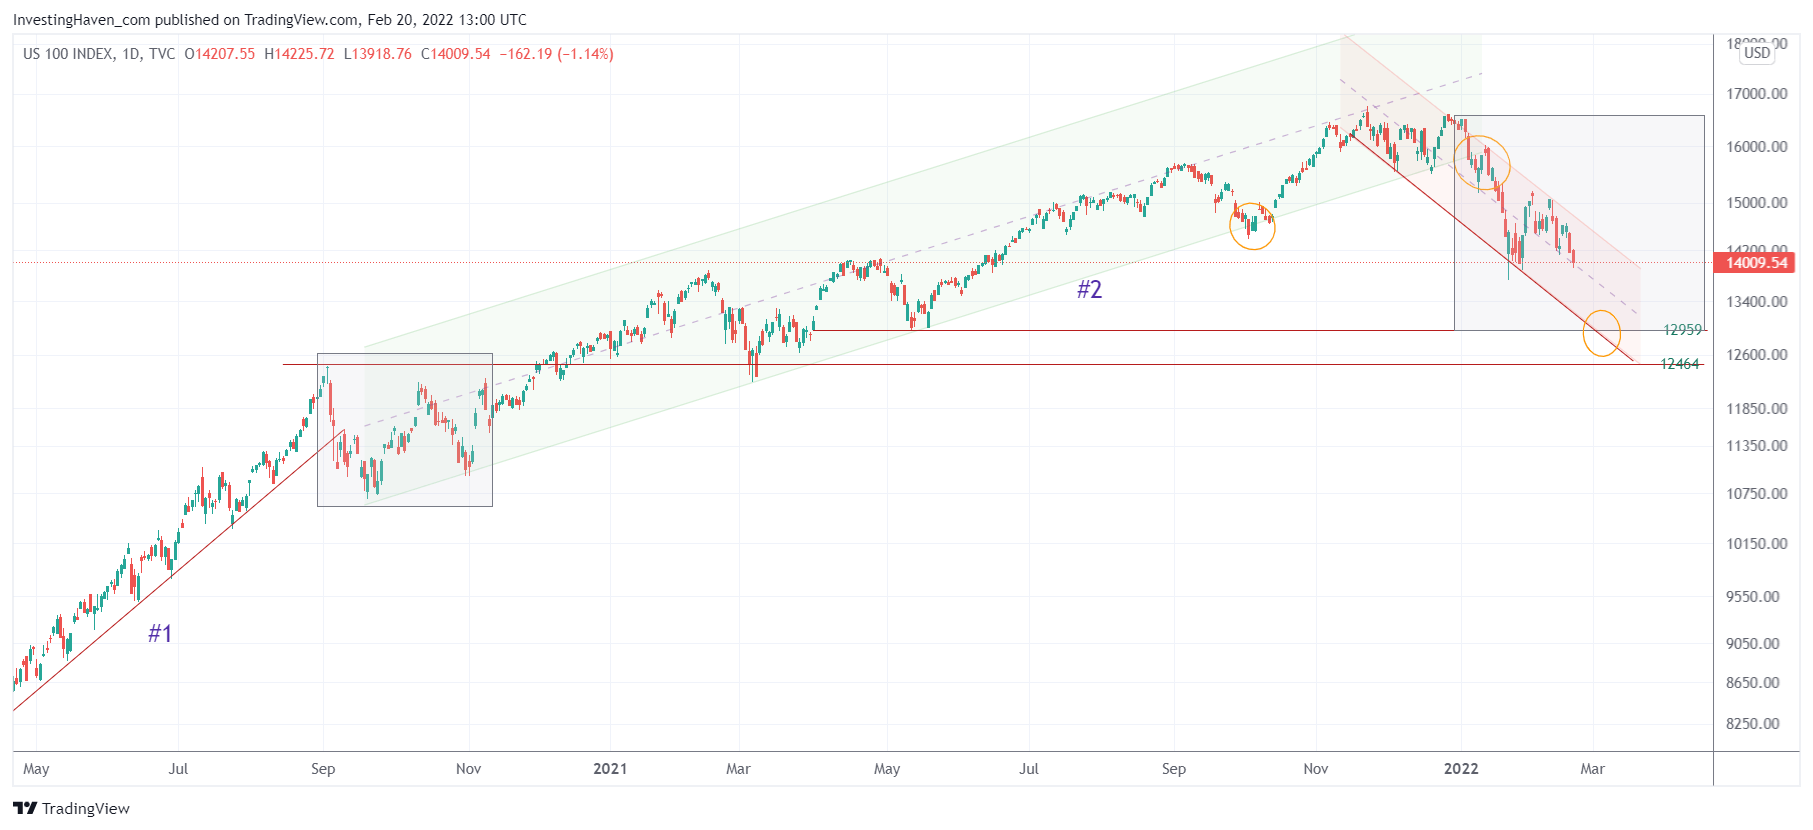
Below is the Nasdaq chart. The downtrend that started in the first week of January is pretty clear, and it might be that the Nasdaq will drop to 12950 points. It might be in a flash crash type fashion, presumably it will be a buy the dip opportunity but who knows maybe it will induce more selling.
As long as 12464 is respected we believe we remain in a long term uptrend. Don’t forget, the ongoing volatility can be part of the long term uptrend. We got a less volatile period in Sept/Oct of 2020 (see grey box), after the first ‘leg higher’ in markets, as seen on below chart. This came with a 2nd ‘leg higher’. Because this index has been rising (higher) for a year (longer) than the first ‘leg higher’ it implies that the subsequent consolidation will be more intense and will take longer (please compare the two grey boxes).
In our Momentum Investing weekend update we shared the top symbols in each of the sectors mentioned above: top copper setups, top silver setups, top graphite setup, top agricultural stocks. We also mentioned a few more symbols that have a bullish long term profile, say 3 to 6 months out. In our Trade Alerts auto-trading strategy we have grown our portfolios so far in 2022, particularly in our S&P500 and SPY options auto-trading strategies. We take care of our auto-trading members: they do nothing and get profits in return in a market that has confused at least 90% of its participants and probably destroyed (for once and for all) at least 50% of portfolios.


