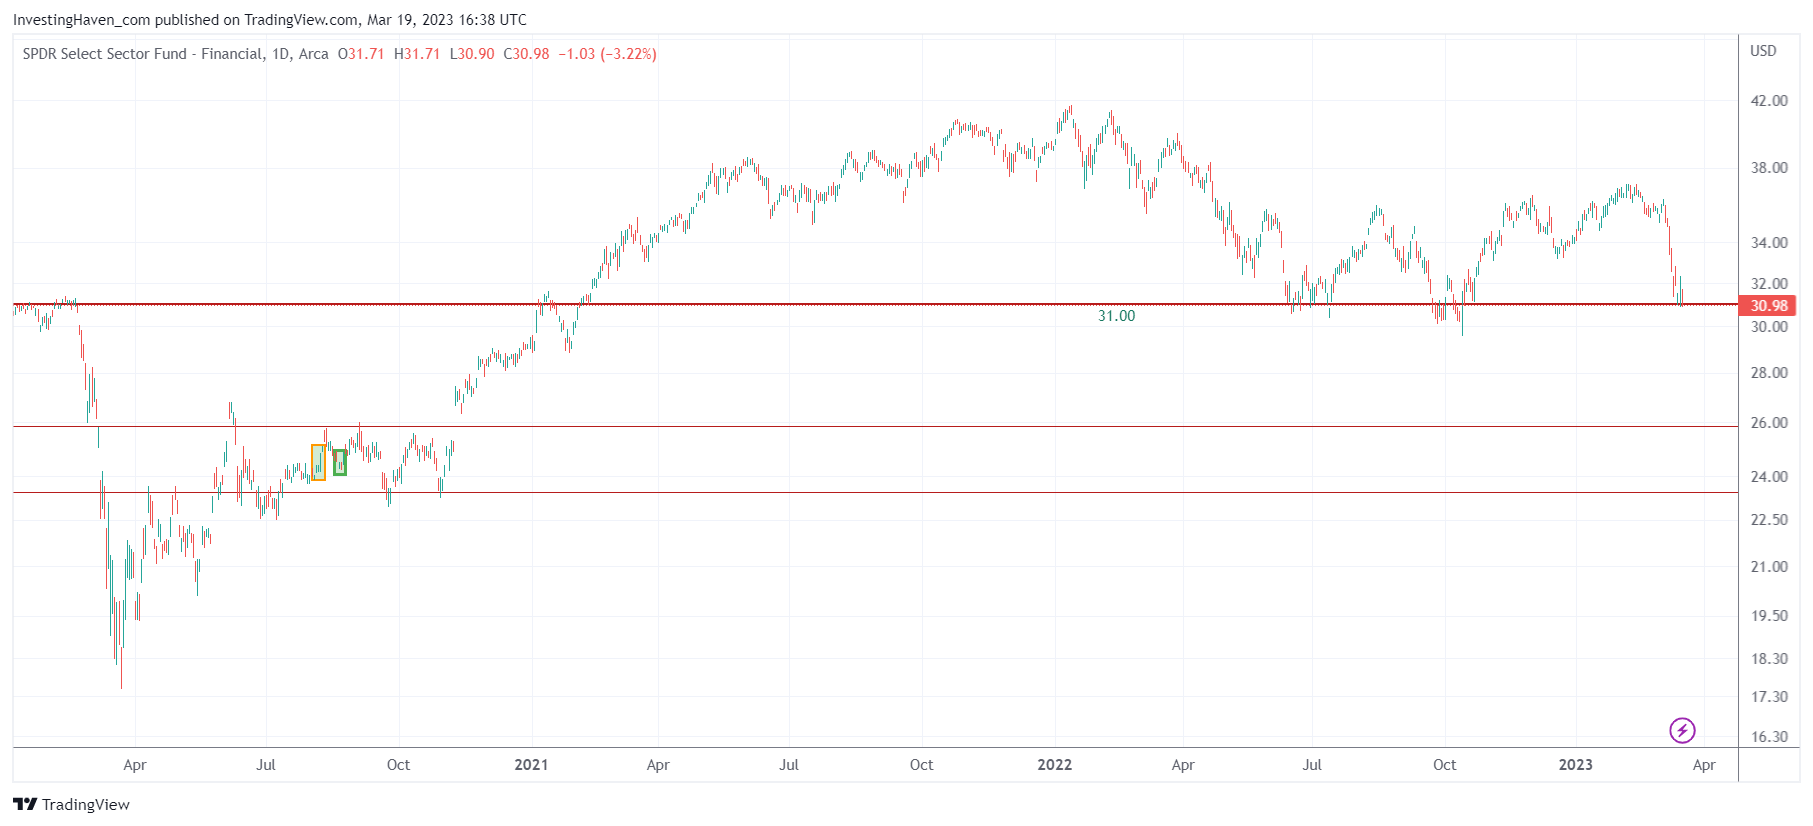
Last week, we wrote How To Know Whether There Is Systemic Risk In This Market? We made the point that we are closely watching XLF ETF, representing the finance sector. The line in the sand on the XLF ETF chart was 31 points. Friday’s close was 30.98 points.
The conclusion we published a week ago: “A bad outcome in markets should be signaled by a violation of XLF ETF. More specifically, the breakdown level is 31 points.”
For now, XLF ETF is still holding. It will certainly continue to thoroughly test the 31 level, similar to what it did in June of 2022 and Sept/Oct of 2022.
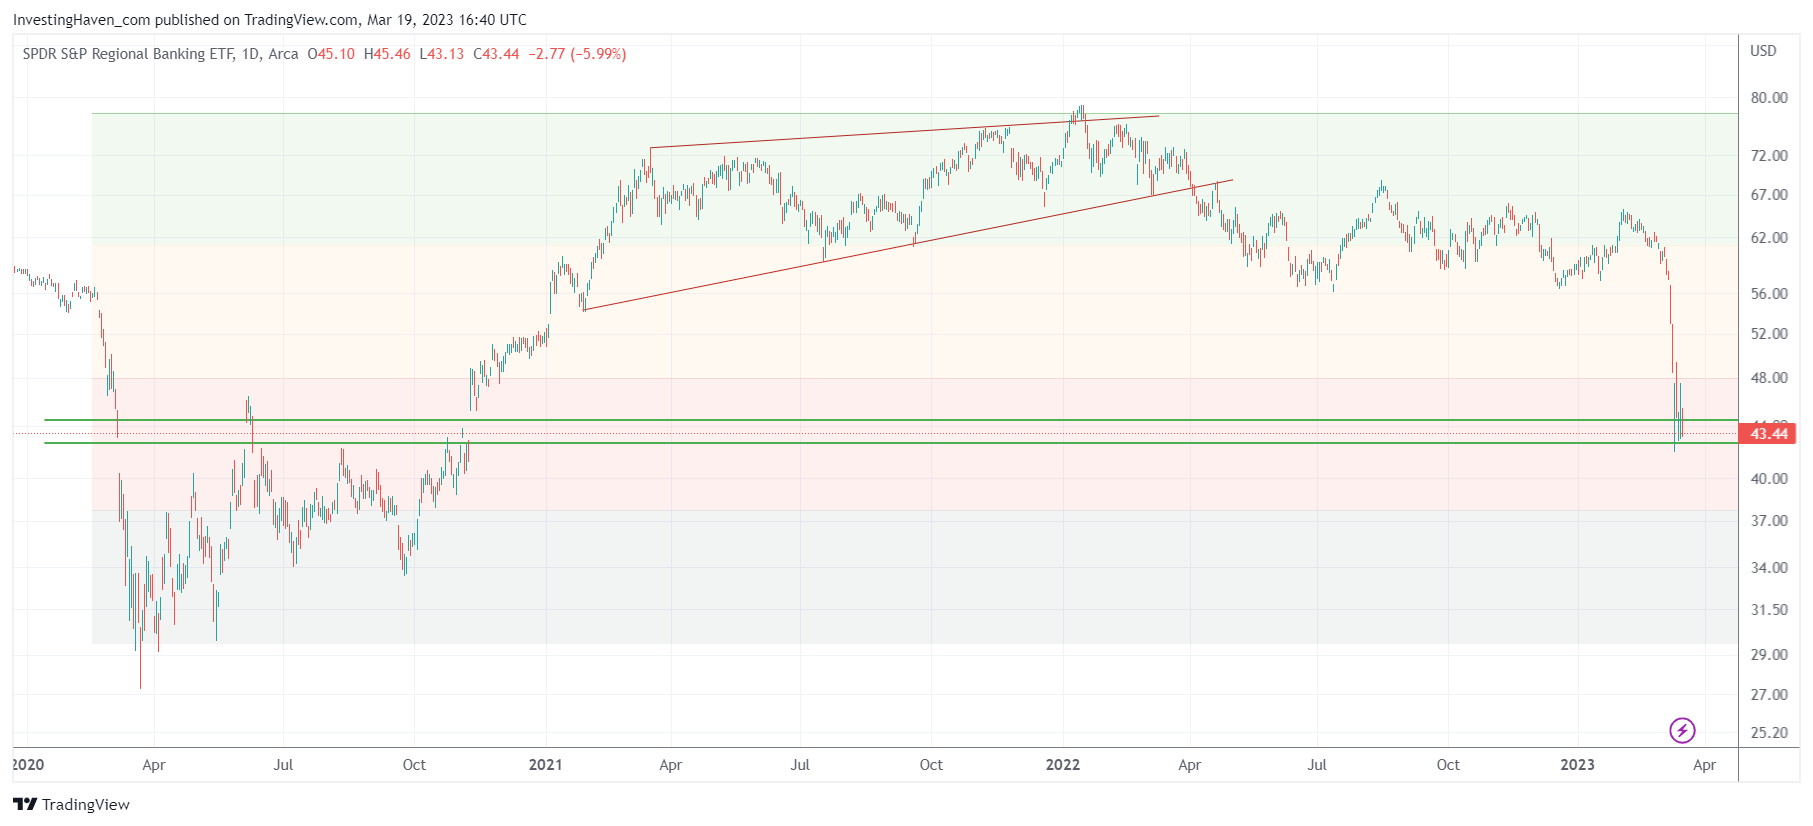
In the meantime, the chart of regional banks KRE ETF broke down.
Once 60 gave up, it went downhill, fast and hard. In a matter of days, KRE ETF crashed from 60 to 43 points.
If we carefully look at the 3 year chart structure, we can see that the 43-45 level is an important one especially because of the two huge gaps that were created in the past (March of 2020 down, Nov of 2020 up).
Stated differently, if this current level is not doing to hold, the next targets will be 38, 34, 30. We are not predicting it will happen, we are saying that the crash can become really bad in case 43-45 does not hold.
We don’t think this banking crisis will be a repeat of 2008. It might happen, but we don’t think so. So far, key indexes are holding up, tech stocks are improving as per the Nasdaq. Once all indexes break key support levels, we will turn bearish.


