
Stocks continue to be extremely fickle. Bullish trends are short-lived, bearish trends tend to dominate. The feeling of extreme bearishness among investors as discussed in last week’s turning point article illustrates how extreme this market feels. But don’t we get extreme feelings near the end of a correction? In other words, how to forecast if this really ugly feeling about stocks is just the beginning or whether it suggests we are closer to the end of a correction?
Well, the problem with sentiment is that it’s not a good timing indicator.
For timing, we need price combined with time. That’s the x and y axis of the chart, both combined.
It’s so strange that 99.9% of analysts are focused on price only. A chart has two axes, not one, yet almost every analysts is focused on just one. What a missed opportunity, so many insights get lots in focusing on just one axis. It’s like trying to live your life watching with one eye closed.
We explained the cycles in more detail in our Trade Alerts weekend edition, and added quite some charts (two of them are embedded in this blog post).
When we look at the time axis of the chart, we see that the next few days should mark the end of the ongoing retracement that started on April 5th.
When it comes to price, we prefer to focus on the long term trend. We don’t work with moving averages because they are lagging, however we can use a price point as a ‘line in the sand’ type data point on a chart.
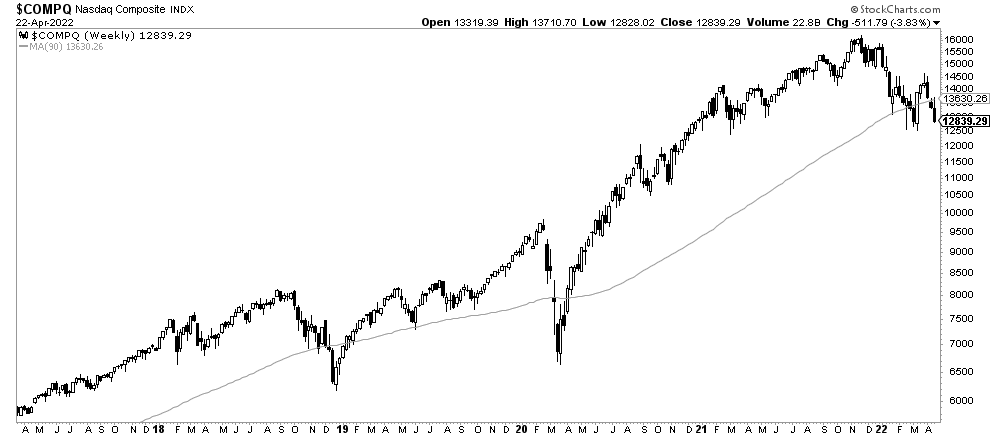
The one and only long term average that has meaning is the 90 week moving average (WMA).
The Nasdaq closed the week below its 90 WMA, that’s concerning for sure!
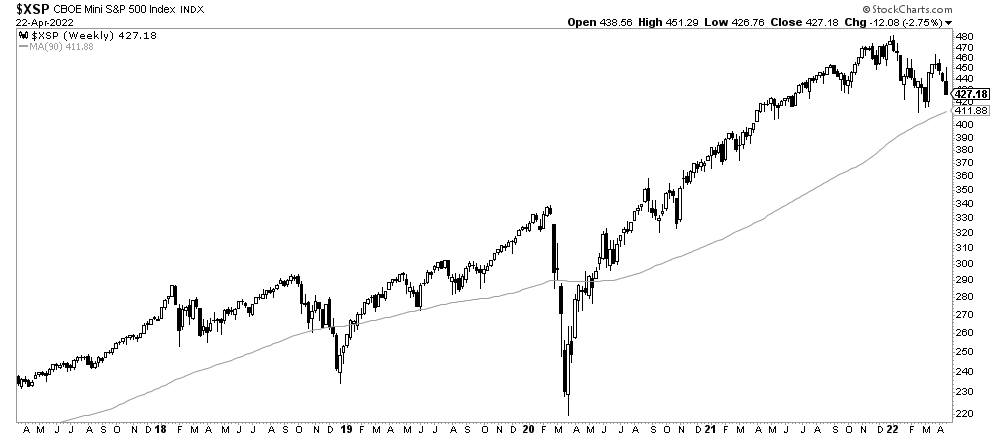
On the flipside, SPX is still above its 90 WMA. And it’s an easy read: 4110 in SPX coincides with the recent lows but also the 90 WMA.
Both the bullish and bearish scenario will be powerful, that’s because the power that comes with the pattern that is in the making in the last 5 months. This, and much more, is explained in great detail in our weekend updates: Momentum Investing for investors and Trade Alerts for traders.
But here is the clue of the story. If you carefully look at the last 2 charts you will notice how you can, simultaneously, a bearish pattern developing and also a potentially bullish reversal. In other words, decision time is here.
Every time you can observe a bullish AND bearish outcome on a chart you know that it can go both directions which means DECISION TIME!


