
Stocks continue to be outrageously bullish. But for how long? And do we need to be concerned short term, medium term, long term? The short version: we believe long term bullish on stocks, but we forecast that a bearish scenario is underway in the short to medium term.
As explained in ‘Watchout Chart’ For February 2021: US Dollar
There is no coincidence in markets. And the USD will create havoc in February of 2021, presumably in all markets. The only unknown is the degree of damage it can create, and for how long it will last. We’ll get a handle on that in the next few weeks. For now, we’ll enjoy the party in stocks for as long as it lasts.
The USD chart is really awesome … for Dollar bulls. Not so for stock market bulls.
It does make sense, from an intermarket perspective, because the stock market chart looks outrageously bullish … but also tired.
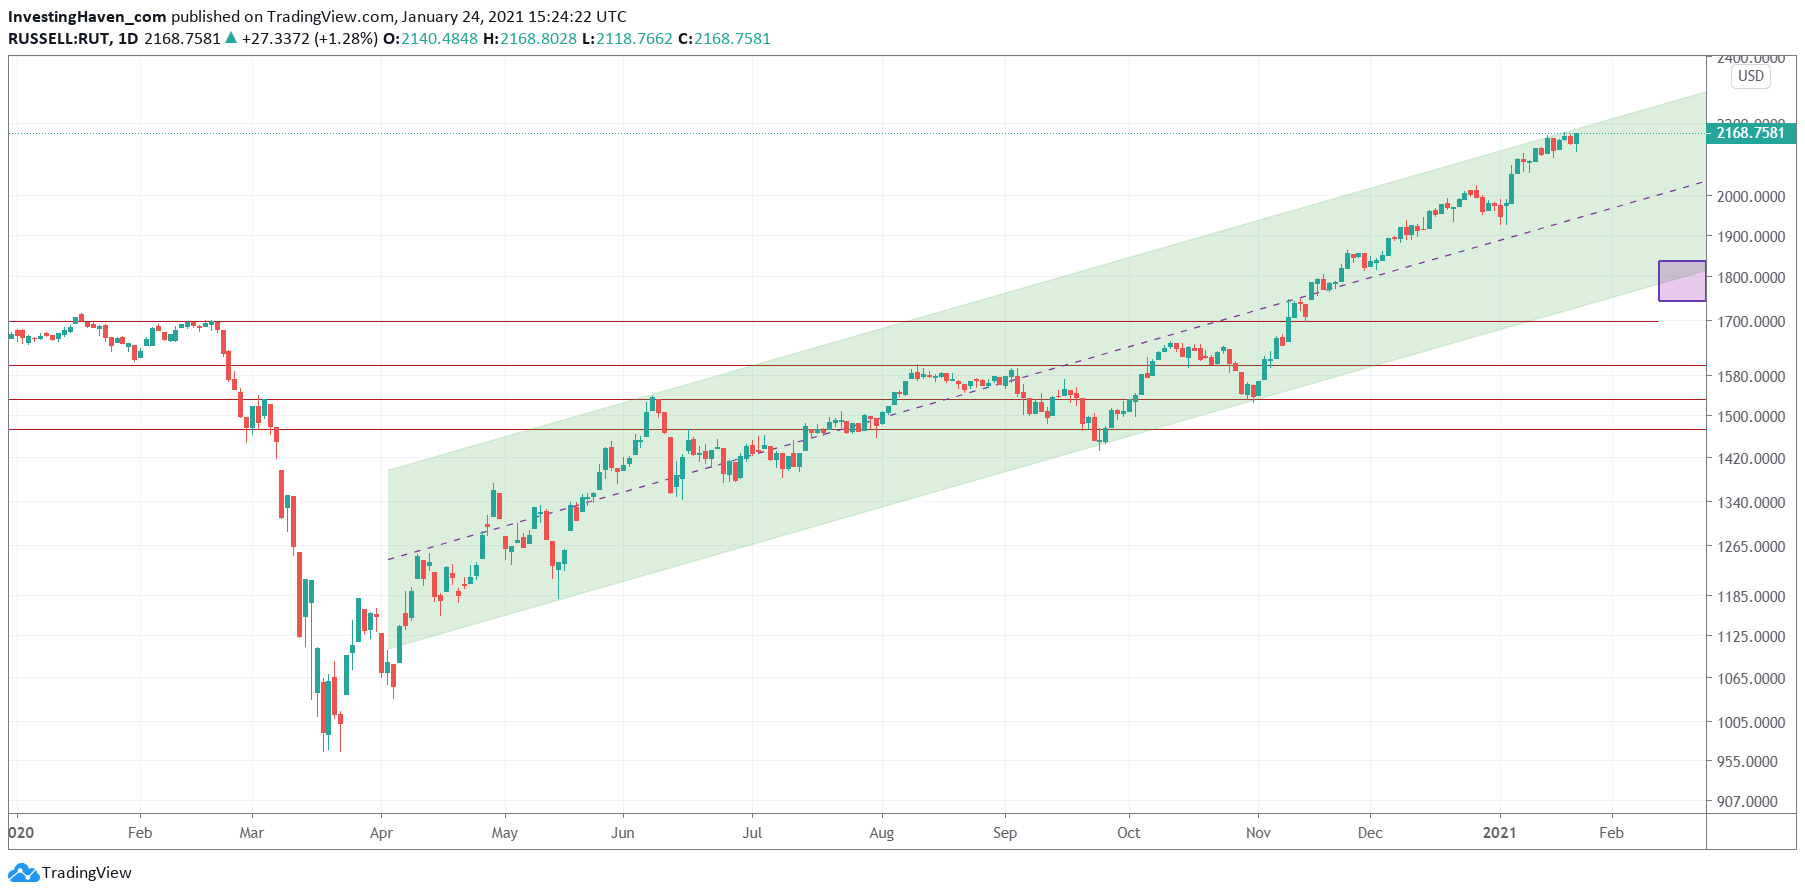
The Russell 2000, as said many times one of our leading indicators for stocks, is testing the resistance area of its post-Corona-crash uptrend. This does not tell anyting about timing, we have a totally different indicator to time the start of a potential retracement … surprise surprise, our leading timing indicator is about send a warning sign early next week (to be confirmed).
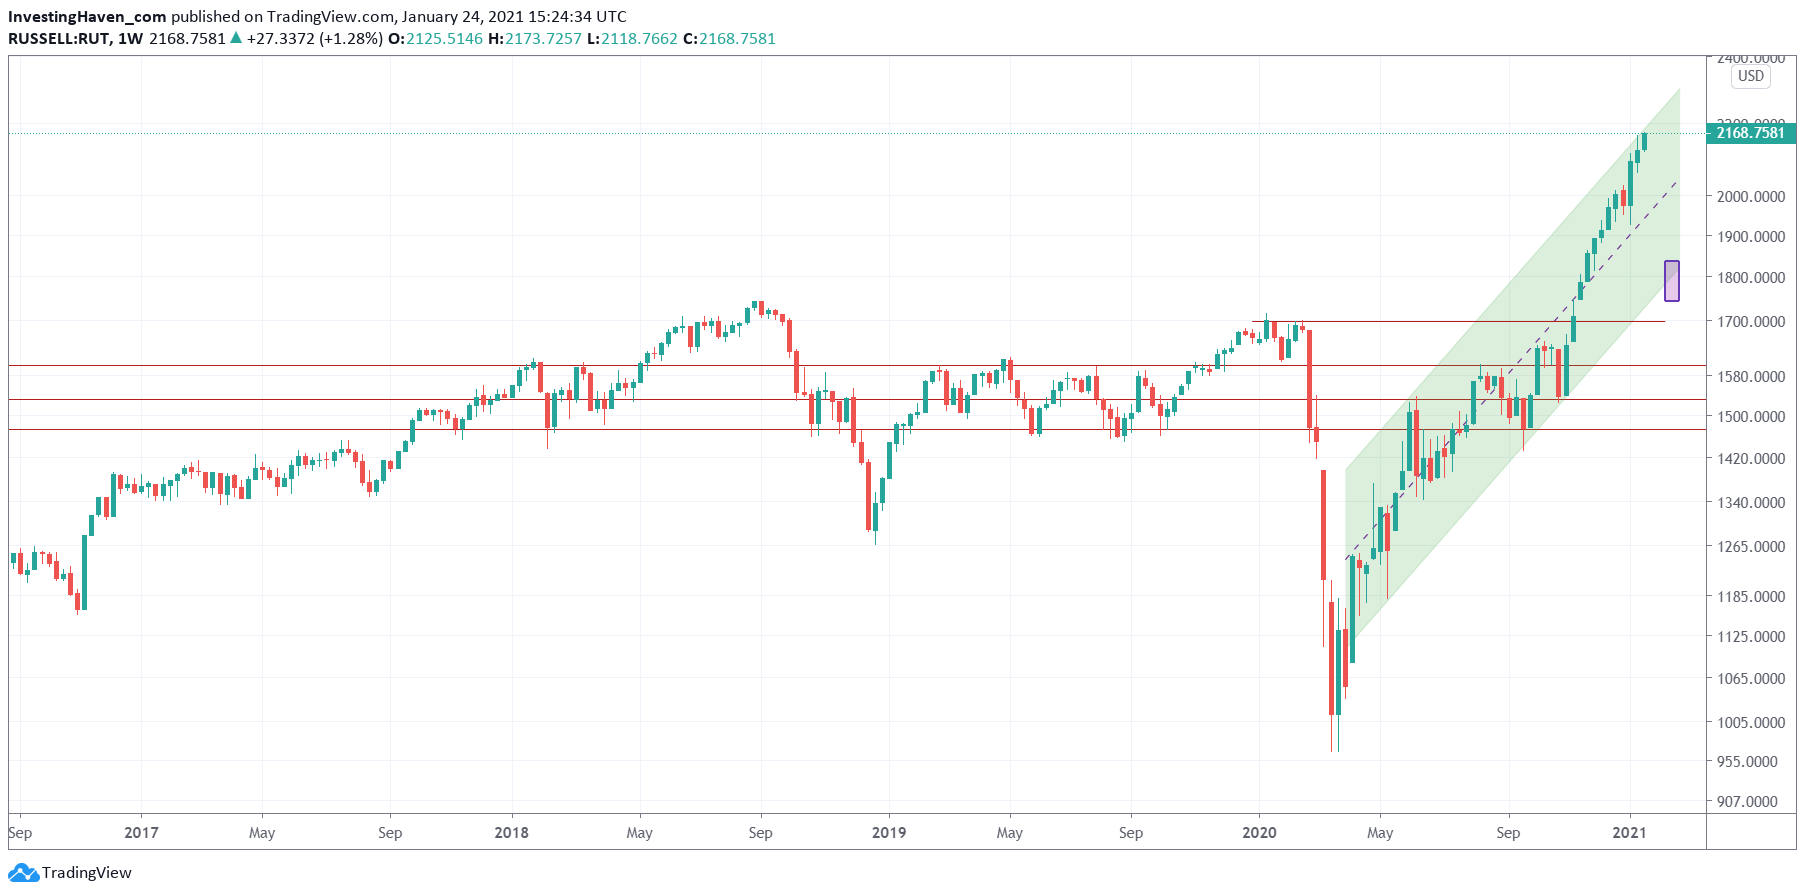
The weekly version of the Russell 2000 chart (below) says it all: this market needs a small break. It has risen fast and high, which is great but not sustainable.
A healthy pullback would be good, not only to enter at lower levels but also to ensure the longer term trend reamins bullish.
It is time for this market to get back to test the 1800 level, not only would it qualify as a bullish backtest to confirm the longer term bull market but also would it give us a nice new entry point.
The purple box on both charts in this article show that the 1800 level (approx.) coincides with the 2018 highs and the support area of the current rising channel.
We would welcome a retracement, and are ready in our portfolios whenever the market decides to go for it. In our Momentum Investing portfolio we are starting to protect our profits by including exit targets to our positions. So far, our portfolio is strongly up in January of 2021, and we will ensure we will protect our profits especially as we look at below chart! Moreover, with some cash we will be able to open new positions at discounted levels. In our short term Trade Alerts portfolio we are waiting for our algo to flash a sell signal, and we have a refined method to maximize profits with any market direction.


